It's been a great afternoon session for Coca-Cola investors, who saw their shares rise 1.4% to a price of $68.87 per share. At these higher prices, is the company still fairly valued? If you are thinking about investing, make sure to check the company's fundamentals before making a decision.
a Very Low P/E Ratio but Trading Above Its Fair Price:
The Coca-Cola Company, a beverage company, manufactures and sells various nonalcoholic beverages in the United States and internationally. The company belongs to the Consumer Staples sector, which has an average price to earnings (P/E) ratio of 25.91 and an average price to book (P/B) ratio of 3.03. In contrast, Coca-Cola has a trailing 12 month P/E ratio of 24.4 and a P/B ratio of 10.37.
Coca-Cola has moved -2.1% over the last year compared to 18.6% for the S&P 500 — a difference of -20.6%. Coca-Cola has a 52 week high of $74.38 and a 52 week low of $60.62.
Positive Cash Flows:
| 2019 | 2020 | 2021 | 2022 | 2023 | 2024 | |
|---|---|---|---|---|---|---|
| Revenue (M) | $37,266 | $33,014 | $38,655 | $43,004 | $45,754 | $47,061 |
| Gross Margins | 61% | 59% | 60% | 57% | 60% | 61% |
| Net Margins | 24% | 23% | 25% | 22% | 23% | 23% |
| Net Income (M) | $8,920 | $7,747 | $9,771 | $9,542 | $10,714 | $10,631 |
| Net Interest Expense (M) | $946 | $1,437 | $1,597 | $882 | $1,527 | $1,656 |
| Depreciation & Amort. (M) | $1,365 | $1,536 | $1,452 | $1,260 | $1,128 | $997 |
| Diluted Shares (M) | 4,314 | 4,323 | 4,340 | 4,350 | 4,339 | 4,320 |
| Earnings Per Share | $2.07 | $1.79 | $2.25 | $2.19 | $2.47 | $2.46 |
| EPS Growth | n/a | -13.53% | 25.7% | -2.67% | 12.79% | -0.4% |
| Avg. Price | $44.84 | $45.47 | $50.87 | $59.81 | $58.01 | $68.94 |
| P/E Ratio | 21.45 | 25.26 | 22.51 | 27.19 | 23.39 | 27.91 |
| Free Cash Flow (M) | $8,417 | $8,667 | $11,258 | $9,534 | $9,747 | $4,741 |
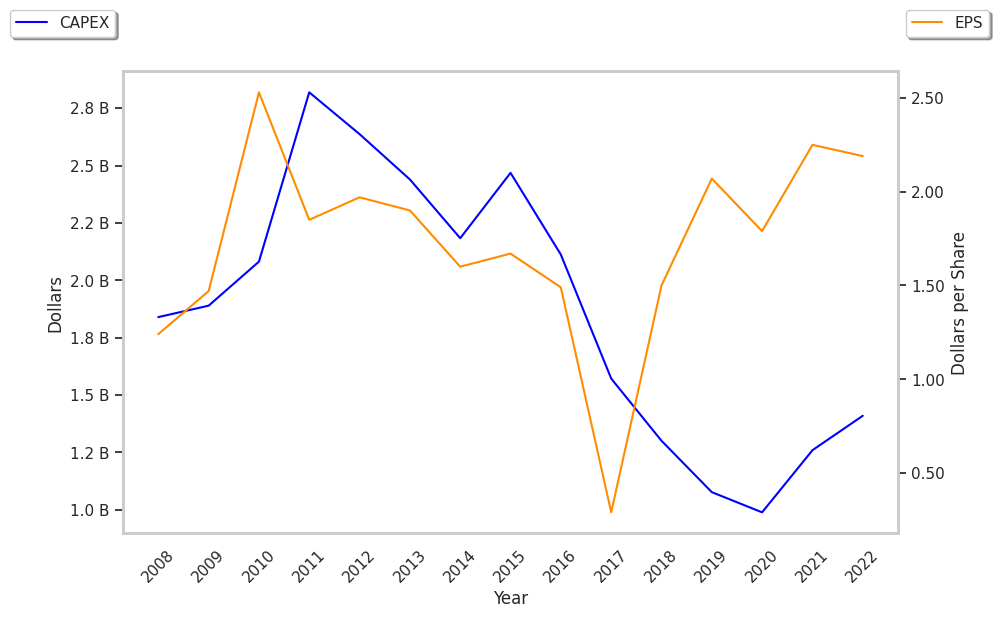
| CAPEX (M) | $2,054 | $1,177 | $1,367 | $1,484 | $1,852 | $2,064 |
| EV / EBITDA | 19.32 | 21.78 | 21.29 | 23.58 | 22.6 | 29.45 |
| Total Debt (M) | $36,022 | $41,095 | $40,792 | $37,175 | $39,467 | $37,144 |
| Net Debt / EBITDA | 2.58 | 3.26 | 2.65 | 2.27 | 2.42 | 2.39 |
| Current Ratio | 0.76 | 1.32 | 1.13 | 1.15 | 1.13 | 1.03 |
Coca-Cola has growing revenues and a flat capital expenditure trend, positive EPS growth, and healthy leverage levels. However, the firm has positive cash flows. Finally, we note that Coca-Cola has just enough current assets to cover current liabilities, as shown by its current ratio of 1.03.