It hasn't been a great afternoon session for Transdigm investors, who have watched their shares sink by -12.8% to a price of $1403.83. Some of you might be wondering if it's time to buy the dip. If you are considering this, make sure to check the company's fundamentals first to determine if the shares are fairly valued at today's prices.
Transdigm's Valuation Is in Line With Its Sector Averages:
TransDigm Group Incorporated designs, produces, and supplies aircraft components in the United States and internationally. The company belongs to the Industrials sector, which has an average price to earnings (P/E) ratio of 24.03. In contrast, Transdigm has a trailing 12 month P/E ratio of 47.4 based on its earnings per share of $29.61.
Transdigm has moved 30.0% over the last year compared to 20.8% for the S&P 500 -- a difference of 9.2%. Transdigm has a 52 week high of $1623.83 and a 52 week low of $1183.6.
Wider Gross Margins Than the Industry Average of 27.31%:
| 2021 | 2022 | 2023 | 2023 | 2024 | 2024 | |
|---|---|---|---|---|---|---|
| Revenue (M) | $4,798 | $5,429 | $6,585 | $6,585 | $7,940 | $7,940 |
| Gross Margins | 52% | 56% | 57% | 57% | 59% | 59% |
| Net Margins | 14% | 16% | 20% | 20% | 22% | 22% |
| Net Income (M) | $680 | $866 | $1,298 | $1,298 | $1,714 | $1,714 |
| Net Interest Expense (M) | -$1,059 | -$1,076 | -$1,164 | -$1,164 | -$1,286 | -$1,286 |
| Depreciation & Amort. (M) | $115 | $116 | $129 | $129 | $149 | $149 |
| Diluted Shares (M) | 58 | 57 | 58 | 58 | 58 | 58 |
| Earnings Per Share | $10.41 | $13.4 | $22.03 | $22.03 | $25.62 | $25.62 |
| EPS Growth | n/a | 28.72% | 64.4% | 0.0% | 16.3% | 0.0% |
| Avg. Price | $600.19 | $596.34 | $964.52 | $964.52 | $1386.06 | $1386.06 |
| P/E Ratio | 57.66 | 44.5 | 43.78 | 43.78 | 54.1 | 54.1 |
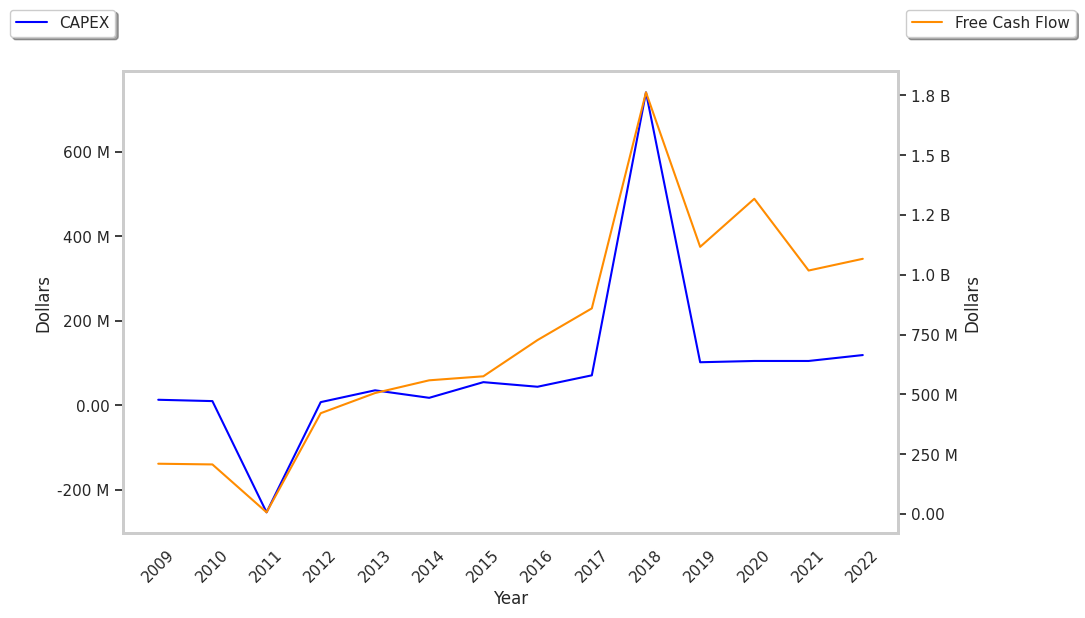
| Free Cash Flow (M) | $808 | $829 | $1,236 | $1,236 | $1,880 | $1,880 |
| CAPEX (M) | $105 | $119 | $139 | $139 | $165 | $165 |
| EV / EBITDA | 26.59 | 21.54 | 23.36 | 23.36 | 27.17 | 27.17 |
| Total Debt (M) | $19,649 | $19,451 | $21,417 | $21,417 | $24,498 | $24,498 |
| Net Debt / EBITDA | 8.23 | 6.93 | 5.88 | 5.88 | 5.99 | 5.99 |
| Current Ratio | 4.23 | 4.21 | 4.07 | 4.07 | 2.7 | 2.7 |
Transdigm benefits from rapidly growing revenues and increasing reinvestment in the business, generally positive cash flows, and an excellent current ratio of 2.7. The company's financial statements show wider gross margins than its peer group and a strong EPS growth trend. However, the firm has a highly leveraged balance sheet.