Now trading at a price of $186.0, AvalonBay Communities has moved -0.2% so far today.
AvalonBay Communities returned losses of -10.4% last year, with its stock price reaching a high of $239.29 and a low of $180.4. Over the same period, the stock underperformed the S&P 500 index by -31.5%. AThe company's 50-day average price was $202.03. AvalonBay Communities, Inc., a member of the S&P 500, is an equity REIT that develops, redevelops, acquires and manages apartment communities in leading metropolitan areas in New England, the New York/New Jersey Metro area, the Mid-Atlantic, the Pacific Northwest, and Northern and Southern California, as well as in the Company's expansion regions of Raleigh-Durham and Charlotte, North Carolina, Southeast Florida, Dallas and Austin, Texas, and Denver, Colorado. Based in Arlington, VA, the Large-Cap Real Estate company has 2,928 full time employees. AvalonBay Communities has offered a 3.7% dividend yield over the last 12 months.
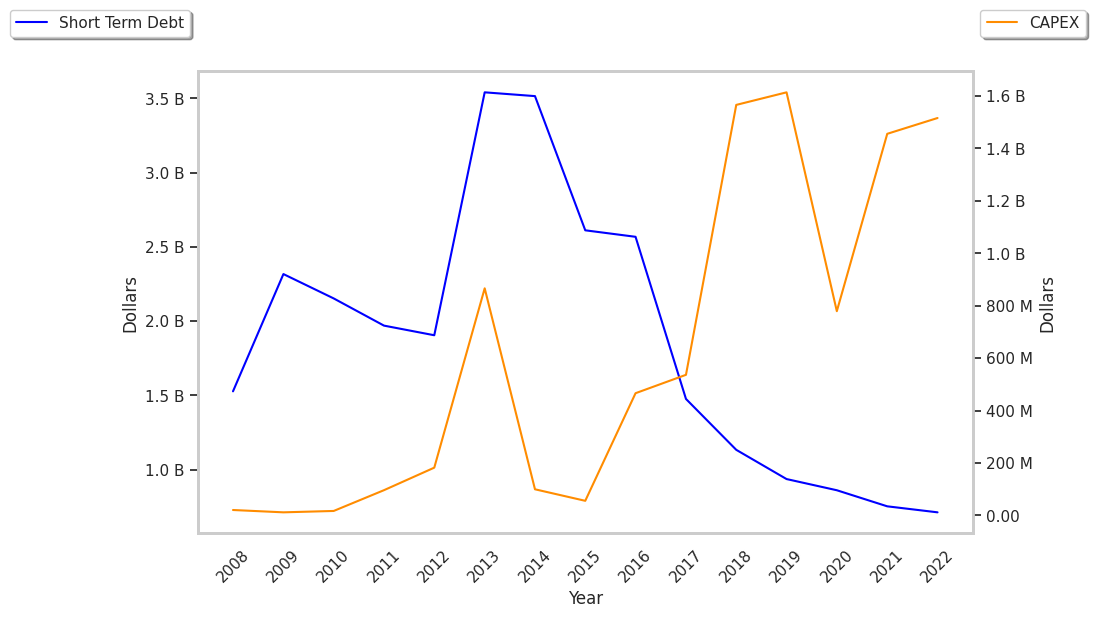
Growing Revenues but Significant Leverage Levels:
| 2019 | 2020 | 2021 | 2022 | 2023 | 2024 | |
|---|---|---|---|---|---|---|
| Revenue (M) | $2,325 | $2,301 | $2,295 | $2,593 | $2,768 | $2,914 |
| Operating Margins | 34% | 36% | 63% | 66% | 67% | 68% |
| Net Margins | 34% | 36% | 44% | 44% | 34% | 37% |
| Net Income (M) | $786 | $828 | $1,004 | $1,136 | $928 | $1,082 |
| Net Interest Expense (M) | $204 | $214 | $220 | $230 | $206 | $227 |
| Depreciation & Amort. (M) | $662 | $707 | $759 | $815 | $817 | $847 |
| Diluted Shares (M) | 140 | 140 | 140 | 140 | 142 | 142 |
| Earnings Per Share | $5.63 | $5.89 | $7.19 | $8.12 | $6.56 | $7.6 |
| EPS Growth | n/a | 4.62% | 22.07% | 12.93% | -19.21% | 15.85% |
| Avg. Price | $177.71 | $150.62 | $196.14 | $218.25 | $175.29 | $186.31 |
| P/E Ratio | 31.51 | 25.57 | 27.28 | 26.85 | 26.72 | 24.48 |
| Free Cash Flow (M) | $1,186 | $1,111 | $1,060 | $1,262 | $1,382 | $1,415 |
| CAPEX (M) | $136 | $109 | $143 | $160 | $178 | $193 |
| EV / EBITDA | 21.86 | 18.67 | 15.82 | 15.18 | 12.01 | 12.2 |
| Total Debt (M) | $7,355 | $7,630 | $8,104 | $8,316 | $7,982 | $8,077 |
| Net Debt / EBITDA | 5.01 | 4.84 | 3.47 | 3.06 | 2.84 | 2.82 |
AvalonBay Communities has growing revenues and increasing reinvestment in the business and strong operating margins with a positive growth rate. Additionally, the company's financial statements display positive EPS growth and generally positive cash flows. Furthermore, AvalonBay Communities has significant leverage levels.
a Decline in Expected Earnings Clouds Its Value Outlook but Priced at a Premium:
AvalonBay Communities has a trailing twelve month P/E ratio of 24.8, compared to an average of 27.31 for the Real Estate sector. Based on its EPS guidance of $5.54, the company has a forward P/E ratio of 36.5. The -0.2% compound average growth rate of AvalonBay Communities's historical and projected earnings per share yields a PEG ratio of -107.94. This indicates that its shares are overvalued.Furthermore, AvalonBay Communities is likely overvalued compared to the book value of its equity, since its P/B ratio of 2.19 is higher than the sector average of 1.94. The company's shares are currently trading 55.4% below their Graham number.
Analysts Give AvalonBay Communities an Average Rating of Buy:
The 20 analysts following AvalonBay Communities have set target prices ranging from $200.0 to $249.0 per share, for an average of $227.15 with a buy rating. The company is trading -18.1% away from its average target price, indicating that there is an analyst consensus of some upside potential.
AvalonBay Communities has an average amount of shares sold short because 3.0% of the company's shares are sold short. Institutions own 96.3% of the company's shares, and the insider ownership rate stands at 0.36%, suggesting a small amount of insider investors. The largest shareholder is Vanguard Group Inc, whose 16% stake in the company is worth $4,217,118,852.