Today we're going to take a closer look at Large-Cap Health Care company Teva Pharmaceutical Industries, whose shares are currently trading at $16.16. We've been asking ourselves whether the company is under or over valued at today's prices... let's perform a brief value analysis to find out!
Teva Pharmaceutical Industries's Valuation Is in Line With Its Sector Averages:
Teva Pharmaceutical Industries Limited develops, manufactures, markets, and distributes generic and other medicines, and biopharmaceutical products in the United States, Europe, Israel, and internationally. The company belongs to the Health Care sector, which has an average price to earnings (P/E) ratio of 22.94 and an average price to book (P/B) ratio of 3.19. In contrast, Teva Pharmaceutical Industries has a trailing 12 month P/E ratio of -107.8 and a P/B ratio of 2.72.
Teva Pharmaceutical Industries has moved -6.7% over the last year compared to 19.3% for the S&P 500 — a difference of -26.0%. Teva Pharmaceutical Industries has a 52 week high of $22.8 and a 52 week low of $12.47.
The Firm Has a Declining EPS Growth Trend:
| 2019 | 2020 | 2021 | 2022 | 2023 | 2024 | |
|---|---|---|---|---|---|---|
| Revenue (M) | $16,887 | $16,659 | $15,878 | $14,925 | $15,846 | $16,544 |
| Gross Margins | 45% | 46% | 48% | 47% | 48% | 49% |
| Net Margins | -6% | -24% | 3% | -16% | -4% | -10% |
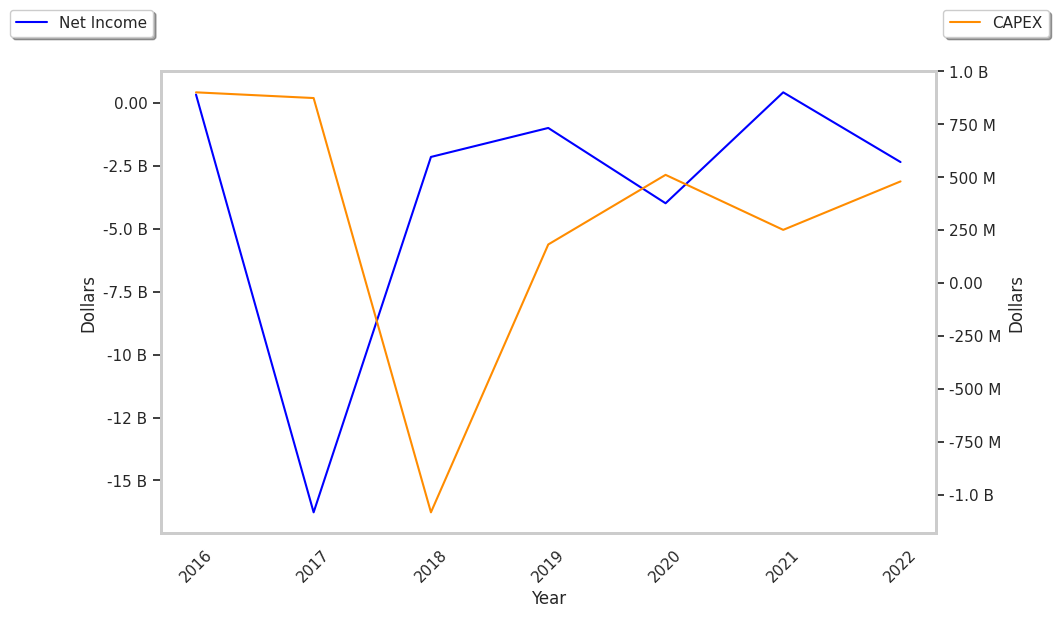
| Net Income (M) | -$999 | -$3,990 | $417 | -$2,446 | -$559 | -$1,639 |
| Net Interest Expense (M) | -$822 | -$834 | -$1,058 | -$966 | -$1,057 | $1,002 |
| Depreciation & Amort. (M) | $1,722 | $1,557 | $1,330 | $1,308 | $1,153 | $471 |
| Diluted Shares (M) | 1,091 | 1,095 | 1,107 | 1,110 | 1,119 | 1,131 |
| Earnings Per Share | -$0.91 | -$3.64 | $0.38 | -$2.2 | -$0.5 | -$1.45 |
| EPS Growth | n/a | -300.0% | 110.44% | -678.95% | 77.27% | -190.0% |
| Avg. Price | $11.5 | $10.43 | $10.09 | $8.49 | $10.44 | $16.01 |
| P/E Ratio | -12.64 | -2.87 | 26.55 | -3.86 | -20.88 | -11.04 |
| Free Cash Flow (M) | $223 | $638 | $236 | $1,042 | $1,368 | $749 |
| CAPEX (M) | $525 | $578 | $562 | $548 | n/a | $498 |
| EV / EBITDA | 11.94 | -7.76 | 3.88 | -12.2 | 7.45 | 109.61 |
| Total Debt (M) | $4,690 | $6,376 | $2,852 | $4,218 | $3,344 | $3,562 |
| Net Debt / EBITDA | 2.12 | -2.08 | 0.23 | -1.59 | 0.07 | 1.56 |
| Current Ratio | 0.98 | 0.99 | 1.14 | 1.05 | 1.02 | 0.98 |
Teva Pharmaceutical Industries has slimmer gross margins than its peers, declining EPS growth, and not enough current assets to cover current liabilities because its current ratio is 0.98. On the other hand, the company benefits from generally positive cash flows and healthy leverage levels. Furthermore, Teva Pharmaceutical Industries has slight revenue growth and a flat capital expenditure trend.