Today we're going to take a closer look at Large-Cap Consumer Discretionary company Walmart, whose shares are currently trading at $103.02. We've been asking ourselves whether the company is under or over valued at today's prices... let's perform a brief value analysis to find out!
The Market May Be Overvaluing Walmart's Earnings and Assets:
Walmart Inc. engages in the operation of retail and wholesale stores and clubs, eCommerce websites, and mobile applications worldwide. The company belongs to the Consumer Discretionary sector, which has an average price to earnings (P/E) ratio of 20.93 and an average price to book (P/B) ratio of 2.93. In contrast, Walmart has a trailing 12 month P/E ratio of 44.0 and a P/B ratio of 9.82.
Walmart has moved 52.8% over the last year compared to 19.3% for the S&P 500 -- a difference of 33.5%. Walmart has a 52 week high of $105.3 and a 52 week low of $66.67.
Positive Cash Flows:
| 2019 | 2020 | 2021 | 2022 | 2023 | 2024 | |
|---|---|---|---|---|---|---|
| Revenue (M) | $523,964 | $559,151 | $572,754 | $611,289 | $648,125 | $680,985 |
| Operating Margins | 4% | 4% | 5% | 3% | 4% | 4% |
| Net Margins | 3% | 2% | 2% | 2% | 2% | 3% |
| Net Income (M) | $14,881 | $13,510 | $13,673 | $11,680 | $15,511 | $19,436 |
| Net Interest Expense (M) | -$2,410 | -$2,194 | -$1,836 | -$1,874 | -$2,137 | -$2,245 |
| Depreciation & Amort. (M) | $10,987 | $11,152 | $10,658 | $10,945 | $11,853 | $12,973 |
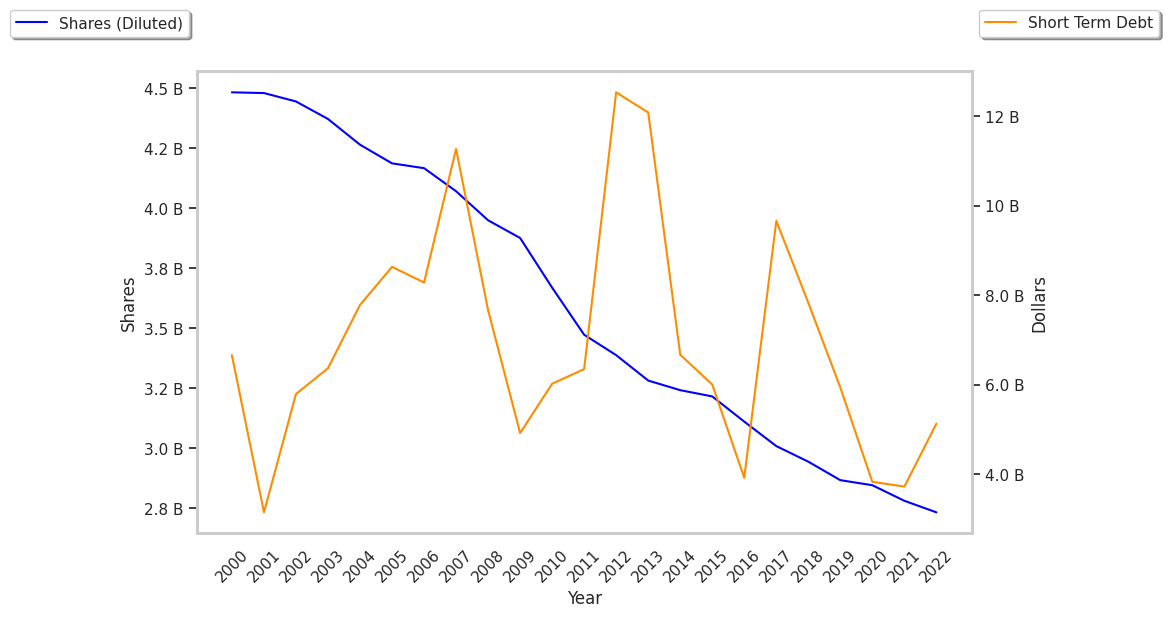
| Diluted Shares (M) | 8,547 | 8,391 | 8,133 | 8,110 | 8,082 | 8,051 |
| Earnings Per Share | $1.74 | $1.61 | $1.68 | $1.44 | $1.92 | $2.41 |
| EPS Growth | n/a | -7.47% | 4.35% | -14.29% | 33.33% | 25.52% |
| Avg. Price | $101.55 | $123.62 | $137.26 | $136.26 | $157.65 | $103.36 |
| P/E Ratio | 58.03 | 77.26 | 82.69 | 94.62 | 82.11 | 42.71 |
| Free Cash Flow (M) | $14,550 | $25,810 | $11,075 | $11,984 | $15,120 | $12,660 |
| CAPEX (M) | $10,705 | $10,264 | $13,106 | $16,857 | $20,606 | $23,783 |
| EV / EBITDA | 28.32 | 31.84 | 31.67 | 35.97 | 33.45 | 20.21 |
| Total Debt (M) | $45,207 | $44,309 | $37,667 | $38,840 | $39,579 | $35,999 |
| Net Debt / EBITDA | 0.98 | 0.84 | 0.71 | 0.85 | 0.76 | 0.63 |
| Current Ratio | 0.84 | 0.95 | 0.86 | 0.85 | 0.85 | 0.78 |
Walmart has growing revenues and increasing reinvestment in the business, positive EPS growth, and healthy leverage levels. However, Walmart has weak operating margins with a stable trend, positive cash flows, and not enough current assets to cover current liabilities because its current ratio is 0.78.