Align Technology logged a -3.3% change during today's afternoon session, and is now trading at a price of $135.22 per share.
Align Technology returned losses of -34.5% last year, with its stock price reaching a high of $262.87 and a low of $127.7. Over the same period, the stock underperformed the S&P 500 index by -54.1%. AThe company's 50-day average price was $182.78. Align Technology, Inc. designs, manufactures, and markets Invisalign clear aligners, Vivera retainers, and iTero intraoral scanners and services in the United States, Switzerland, and internationally. Based in Tempe, AZ, the Mid-Cap Health Care company has 21,485 full time employees. Align Technology has not offered a dividend during the last year.
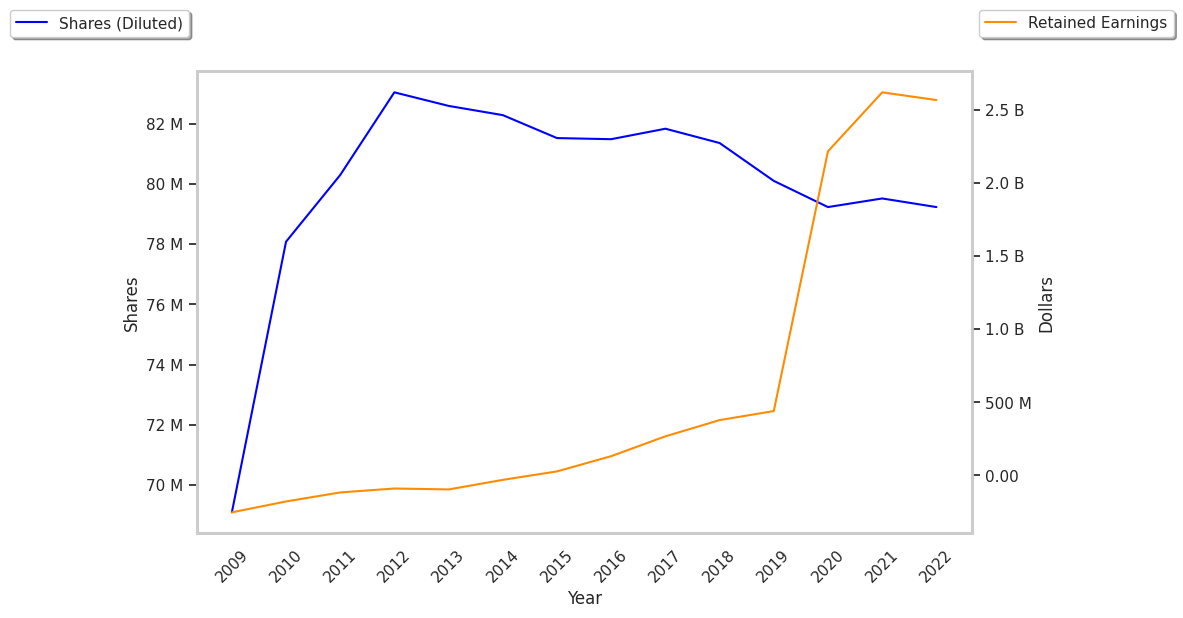
EPS Trend Sustained Primarily by Reducing the Number of Shares Outstanding:
| 2019 | 2020 | 2021 | 2022 | 2023 | 2024 | |
|---|---|---|---|---|---|---|
| Revenue (M) | $2,407 | $2,472 | $3,953 | $3,735 | $3,862 | $3,999 |
| Gross Margins | 72% | 71% | 74% | 71% | 70% | 70% |
| Net Margins | 18% | 72% | 20% | 10% | 12% | 11% |
| Net Income (M) | $443 | $1,776 | $772 | $362 | $445 | $421 |
| Net Interest Expense (M) | $12 | $3 | $3 | $5 | $17 | $20 |
| Depreciation & Amort. (M) | $79 | $94 | $109 | $126 | $142 | $126 |
| Diluted Shares (M) | 80 | 79 | 80 | 78 | 77 | 75 |
| Earnings Per Share | $5.53 | $22.41 | $9.69 | $4.61 | $5.81 | $5.62 |
| EPS Growth | n/a | 305.24% | -56.76% | -52.43% | 26.03% | -3.27% |
| Avg. Price | $249.39 | $305.72 | $617.52 | $391.45 | $274.0 | $135.65 |
| P/E Ratio | 44.77 | 13.56 | 63.14 | 84.73 | 47.08 | 24.09 |
| Free Cash Flow (M) | $598 | $507 | $771 | $277 | $608 | $623 |
| CAPEX (M) | $150 | $155 | $401 | $292 | $178 | $116 |
| Current Ratio | 1.68 | 1.4 | 1.3 | 1.26 | 1.18 | 1.22 |
Align Technology has rapidly growing revenues and decreasing reinvestment in the business, wider gross margins than its peer group, and generally positive cash flows. However, the firm has EPS growth achieved by reducing the number of outstanding shares. Finally, we note that Align Technology has just enough current assets to cover current liabilities, as shown by its current ratio of 1.22.
a Lower P/B Ratio Than Its Sector Average but Priced at a Premium:
Align Technology has a trailing twelve month P/E ratio of 30.9, compared to an average of 22.94 for the Health Care sector. Based on its EPS guidance of $10.26, the company has a forward P/E ratio of 17.8. The 9.2% compound average growth rate of Align Technology's historical and projected earnings per share yields a PEG ratio of 3.34. This suggests that these shares are overvalued. In contrast, the market is likely undervaluing Align Technology in terms of its equity because its P/B ratio is 2.51 while the sector average is 3.19. The company's shares are currently trading 67.8% below their Graham number.
Align Technology Has an Average Rating of Buy:
The 14 analysts following Align Technology have set target prices ranging from $140.0 to $220.0 per share, for an average of $186.36 with a buy rating. The company is trading -27.4% away from its average target price, indicating that there is an analyst consensus of strong upside potential.
Align Technology has an average amount of shares sold short because 4.9% of the company's shares are sold short. Institutions own 94.1% of the company's shares, and the insider ownership rate stands at 6.69%, suggesting a decent amount of insider shareholders. The largest shareholder is Vanguard Group Inc, whose 12% stake in the company is worth $1,141,501,577.