Now trading at a price of $199.92, Alphabet has moved -1.1% so far today.
Alphabet returned gains of 23.3% last year, with its stock price reaching a high of $208.7 and a low of $142.66. Over the same period, the stock outperformed the S&P 500 index by 3.7%. More recently, the company's 50-day average price was $181.74. Alphabet Inc. offers various products and platforms in the United States, Europe, the Middle East, Africa, the Asia-Pacific, Canada, and Latin America. Based in Mountain View, CA, the Large-Cap Technology company has 187,103 full time employees. Alphabet has offered a 0.5% dividend yield over the last 12 months.
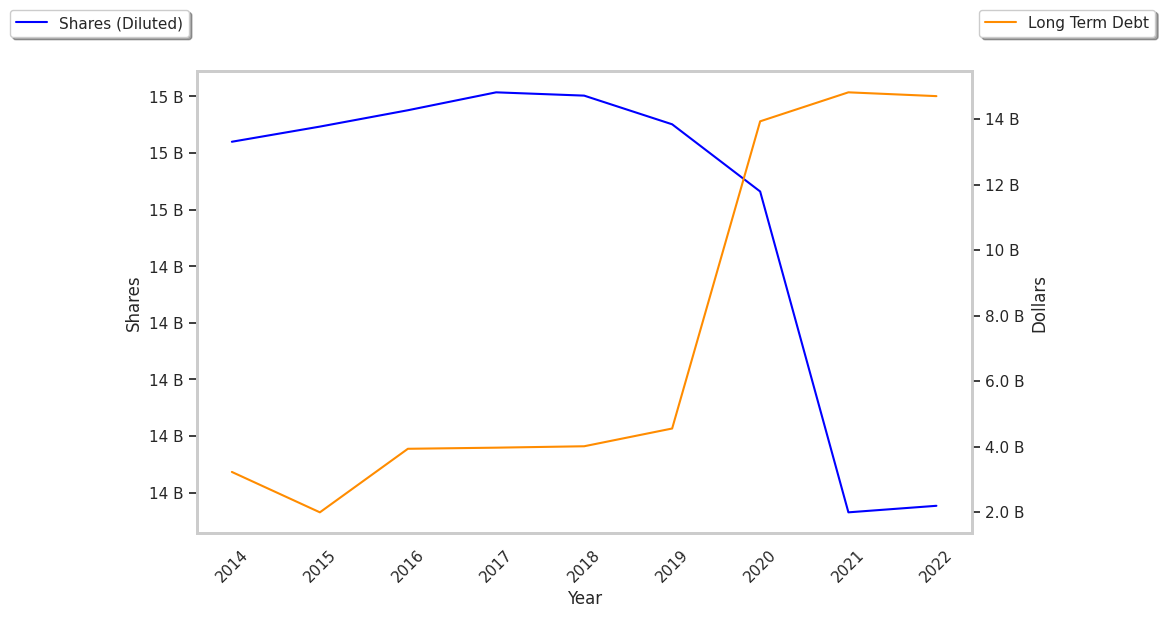
Strong Revenue Growth and Healthy Leverage Levels:
| 2019 | 2020 | 2021 | 2022 | 2023 | 2024 | |
|---|---|---|---|---|---|---|
| Revenue (M) | $161,857 | $182,527 | $257,637 | $282,836 | $307,394 | $350,018 |
| Operating Margins | 21% | 23% | 31% | 26% | 27% | 32% |
| Net Margins | 21% | 22% | 30% | 21% | 24% | 28% |
| Net Income (M) | $34,343 | $40,269 | $76,033 | $59,972 | $73,795 | $100,118 |
| Net Interest Expense (M) | $100 | $135 | $346 | $357 | $308 | $4,482 |
| Depreciation & Amort. (M) | $925 | $792 | $10,273 | $13,475 | $11,946 | $15,311 |
| Diluted Shares (M) | 13,904 | 13,746 | 13,483 | 13,159 | 12,722 | 12,447 |
| Earnings Per Share | $2.47 | $2.93 | $5.64 | $4.56 | $5.8 | $8.04 |
| EPS Growth | n/a | 18.62% | 92.49% | -19.15% | 27.19% | 38.62% |
| Avg. Price | $59.42 | $74.07 | $125.53 | $126.61 | $140.93 | $202.09 |
| P/E Ratio | 24.06 | 25.28 | 22.26 | 27.89 | 24.47 | 25.1 |
| Free Cash Flow (M) | $30,972 | $42,843 | $67,012 | $60,010 | $69,495 | $72,764 |
| CAPEX (M) | $23,548 | $22,281 | $24,640 | $31,485 | $32,251 | $52,535 |
| EV / EBITDA | 23.1 | 23.93 | 18.95 | 18.87 | 18.63 | 19.59 |
| Total Debt (M) | $4,554 | $13,932 | $14,817 | $14,701 | $11,870 | $12,000 |
| Net Debt / EBITDA | -0.4 | -0.3 | -0.07 | -0.08 | -0.13 | -0.09 |
| Current Ratio | 3.37 | 3.07 | 2.93 | 2.38 | 2.1 | 1.84 |
Alphabet has rapidly growing revenues and increasing reinvestment in the business, strong operating margins with a positive growth rate, and exceptional EPS growth. The company also benefits from generally positive cash flows, a decent current ratio of 1.84, and healthy leverage levels.
a Very Low P/E Ratio but Priced Beyond Its Margin of Safety:
Alphabet has a trailing twelve month P/E ratio of 19.4, compared to an average of 30.44 for the Technology sector. Based on its EPS guidance of $8.95, the company has a forward P/E ratio of 20.3. According to the 20.2% compound average growth rate of Alphabet's historical and projected earnings per share, the company's PEG ratio is 0.96. Taking the weighted average of the company's EPS CAGR and the broader market's 5-year projected EPS growth rate, we obtain a normalized growth rate of 13.7%. On this basis, the company's PEG ratio is 1.41. This implies that the shares are fairly valued. In contrast, Alphabet is likely overvalued compared to the book value of its equity, since its P/B ratio of 6.67 is higher than the sector average of 4.19. The company's shares are currently trading 190.8% below their Graham number. Ultimately, Alphabet's strong cash flows, decent earnings multiple, and healthy debt levels factor towards it being fairly valued, its elevated P/B ratio notwithstanding.
Analysts Give Alphabet an Average Rating of Buy:
The 19 analysts following Alphabet have set target prices ranging from $185.0 to $237.0 per share, for an average of $217.19 with a buy rating. The company is trading -8.0% away from its average target price, indicating that there is an analyst consensus of some upside potential.
The largest shareholder is Vanguard Group Inc, whose 8% stake in the company is worth $82,281,257,972.