We've been asking ourselves recently if the market has placed a fair valuation on Suncor Energy. Let's dive into some of the fundamental values of this Large-Cap Energy company to determine if there might be an opportunity here for value-minded investors.
Suncor Energy Has Attractive P/B and P/E Ratios:
Suncor Energy Inc. operates as an integrated energy company in Canada, the United States, and internationally. The company belongs to the Energy sector, which has an average price to earnings (P/E) ratio of 18.35 and an average price to book (P/B) ratio of 1.6. In contrast, Suncor Energy has a trailing 12 month P/E ratio of 11.8 and a P/B ratio of 1.06.
Suncor Energy has moved -3.2% over the last year compared to 19.6% for the S&P 500 -- a difference of -22.8%. Suncor Energy has a 52 week high of $41.95 and a 52 week low of $30.79.
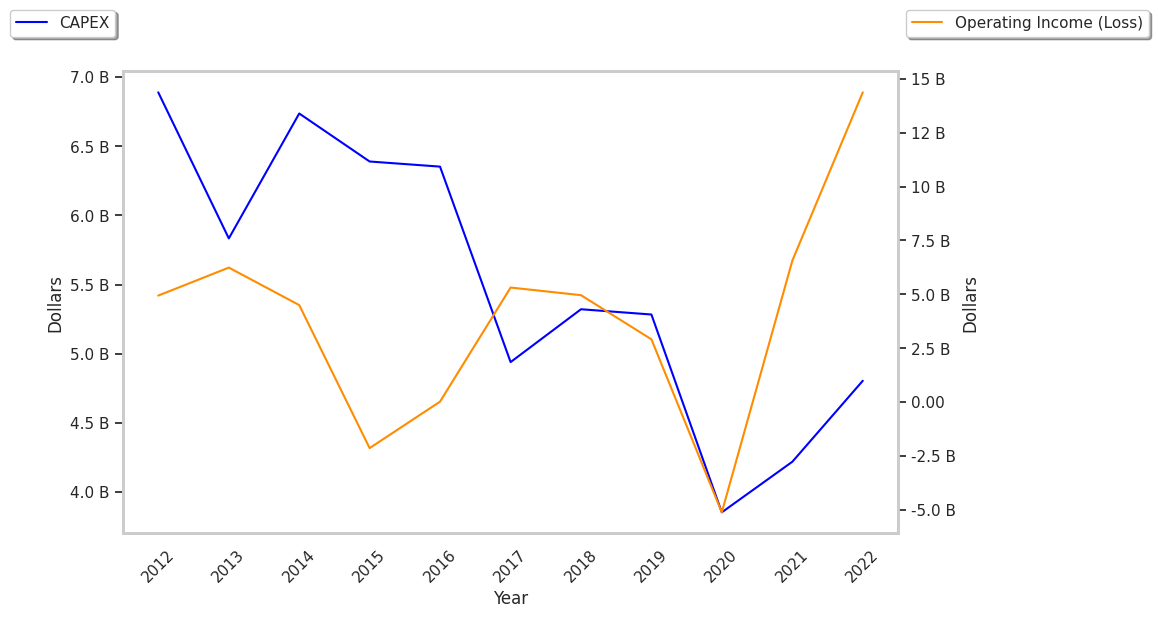
Generally Positive Cash Flows but an Average Current Ratio:
| 2019 | 2020 | 2021 | 2022 | 2023 | 2024 | |
|---|---|---|---|---|---|---|
| Revenue (M) | $38,989 | $25,052 | $39,101 | $62,907 | $52,206 | $54,881 |
| Net Margins | 7% | -17% | 11% | 14% | 16% | 11% |
| Net Income (M) | $2,899 | -$4,319 | $4,119 | $9,077 | $8,295 | $6,016 |
| Net Interest Expense (M) | $875 | $930 | $851 | $814 | $726 | $623 |
| Depreciation & Amort. (M) | $10,572 | $9,526 | $5,850 | $8,786 | $6,435 | $6,954 |
| Earnings Per Share | $1.86 | -$2.83 | $2.77 | $6.53 | $6.33 | $4.72 |
| EPS Growth | n/a | -252.1505376344086% | 197.8798586572438% | 135.74007220216606% | -3.06278713629403% | -25.43443917851501% |
| Avg. Price | $26.58 | $16.14 | $19.89 | $31.21 | $32.04 | $38.82 |
| P/E Ratio | 14.29 | -5.7 | 7.18 | 4.77 | 5.05 | 8.22 |
| Free Cash Flow (M) | $10,421 | $2,675 | $11,764 | $15,680 | $12,344 | $15,960 |
| Total Debt (M) | $12,884 | $13,812 | $13,989 | $9,800 | $11,087 | $9,348 |
| Current Ratio | 0.94 | 0.89 | 1.06 | 1.13 | 1.44 | 1.33 |