US Foods shares fell by -2.2% during the day's afternoon session, and are now trading at a price of $78.33. Is it time to buy the dip? To better answer that question, it's essential to check if the market is valuing the company's shares fairly in terms of its earnings and equity levels.
US Foods's Valuation Is in Line With Its Sector Averages:
US Foods Holding Corp., together with its subsidiaries, engages in marketing, sale, and distribution of fresh, frozen, and dry food and non-food products to foodservice customers in the United States. The company belongs to the Consumer Discretionary sector, which has an average price to earnings (P/E) ratio of 20.93 and an average price to book (P/B) ratio of 2.93. In contrast, US Foods has a trailing 12 month P/E ratio of 33.5 and a P/B ratio of 3.87.
US Foods has moved 52.8% over the last year compared to 19.6% for the S&P 500 -- a difference of 33.3%. US Foods has a 52 week high of $85.11 and a 52 week low of $51.62.
The Firm Has a Highly Leveraged Balance Sheet:
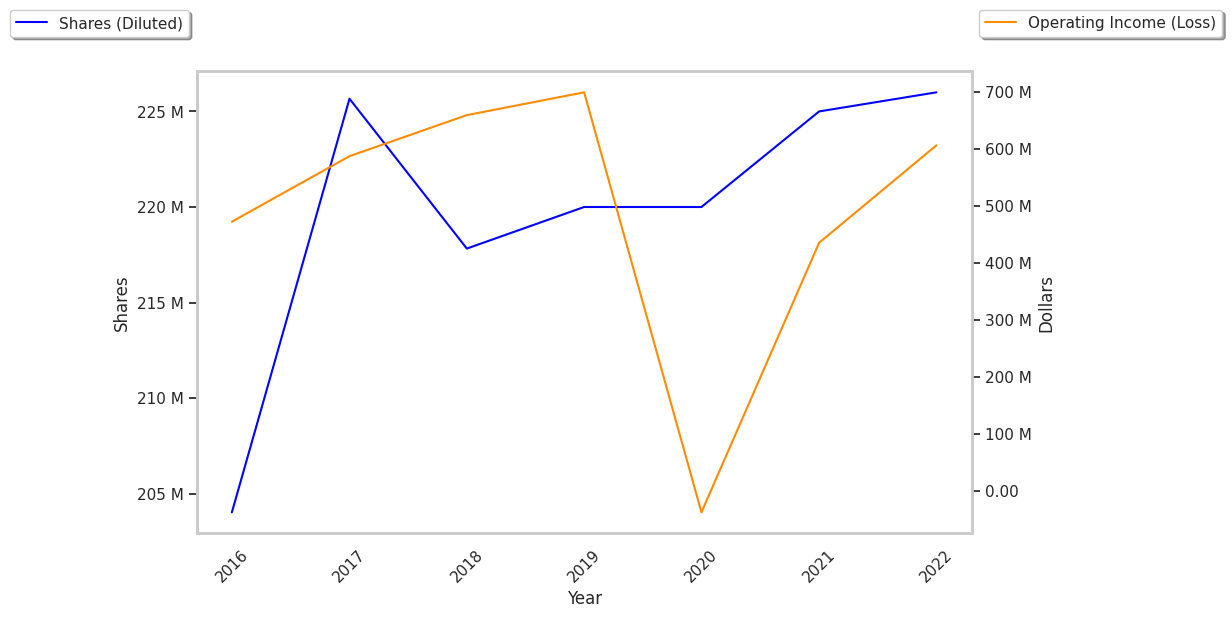
| 2018 | 2019 | 2021 | 2022 | 2023 | 2024 | |
|---|---|---|---|---|---|---|
| Revenue (M) | $24,175 | $25,939 | $22,885 | $29,487 | $35,597 | $37,877 |
| Gross Margins | 18% | 18% | 16% | 16% | 17% | 17% |
| Net Margins | 2% | 1% | -1% | 1% | 1% | 1% |
| Net Income (M) | $407 | $385 | -$226 | $164 | $506 | $494 |
| Net Interest Expense (M) | $175 | $184 | $238 | $213 | $324 | $284 |
| Depreciation & Amort. (M) | $340 | $362 | $422 | $378 | $395 | $384 |
| Diluted Shares (M) | 218 | 220 | 225 | 226 | 250 | 244 |
| Earnings Per Share | $1.87 | $1.75 | -$1.15 | $0.54 | $2.02 | $2.02 |
| EPS Growth | n/a | -6.42% | -165.71% | 146.96% | 274.07% | 0.0% |
| Avg. Price | $33.39 | $37.38 | $36.0 | $35.0 | $45.41 | $78.81 |
| P/E Ratio | 17.76 | 21.12 | -31.3 | 63.64 | 21.73 | 38.44 |
| Free Cash Flow (M) | $374 | $502 | $224 | $145 | $831 | $833 |
| CAPEX (M) | $235 | $258 | $189 | $274 | $309 | $341 |
| EV / EBITDA | 10.56 | 12.05 | 36.52 | 15.5 | 10.33 | 16.3 |
| Total Debt (M) | $3,457 | $4,736 | $5,412 | $4,833 | $4,674 | $4,928 |
| Net Debt / EBITDA | 3.36 | 4.38 | 13.45 | 5.76 | 3.12 | 3.28 |
| Current Ratio | 1.43 | 1.38 | 1.48 | 1.37 | 1.3 | 1.21 |
US Foods has growing revenues and increasing reinvestment in the business, generally positive cash flows, and positive EPS growth. However, the firm suffers from slimmer gross margins than its peers and a highly leveraged balance sheet. Finally, we note that US Foods has just enough current assets to cover current liabilities, as shown by its current ratio of 1.21.