McKesson shares fell by -1.5% during the day's afternoon session, and are now trading at a price of $662.65. Is it time to buy the dip? To better answer that question, it's essential to check if the market is valuing the company's shares fairly in terms of its earnings and equity levels.
McKesson's Valuation Is in Line With Its Sector Averages:
McKesson Corporation provides healthcare services in the United States and internationally. The company belongs to the Health Care sector, which has an average price to earnings (P/E) ratio of 22.94. In contrast, McKesson has a trailing 12 month P/E ratio of 26.5 based on its earnings per share of $24.96.
McKesson has moved 21.9% over the last year compared to 17.3% for the S&P 500 -- a difference of 4.7%. McKesson has a 52 week high of $737.89 and a 52 week low of $464.42.
Growing Revenues but Not Enough Current Assets to Cover Current Liabilities:
| 2019 | 2020 | 2021 | 2022 | 2023 | 2024 | |
|---|---|---|---|---|---|---|
| Revenue (M) | $231,051 | $238,228 | $263,966 | $276,711 | $308,951 | $359,051 |
| Gross Margins | 5% | 5% | 5% | 4% | 4% | 4% |
| Net Margins | 0% | -2% | 0% | 1% | 1% | 1% |
| Net Income (M) | $900 | -$4,539 | $1,114 | $3,560 | $3,002 | $3,295 |
| Net Interest Expense (M) | $249 | $217 | $178 | $248 | $252 | $273 |
| Depreciation & Amort. (M) | $321 | $321 | $279 | $248 | $253 | $242 |
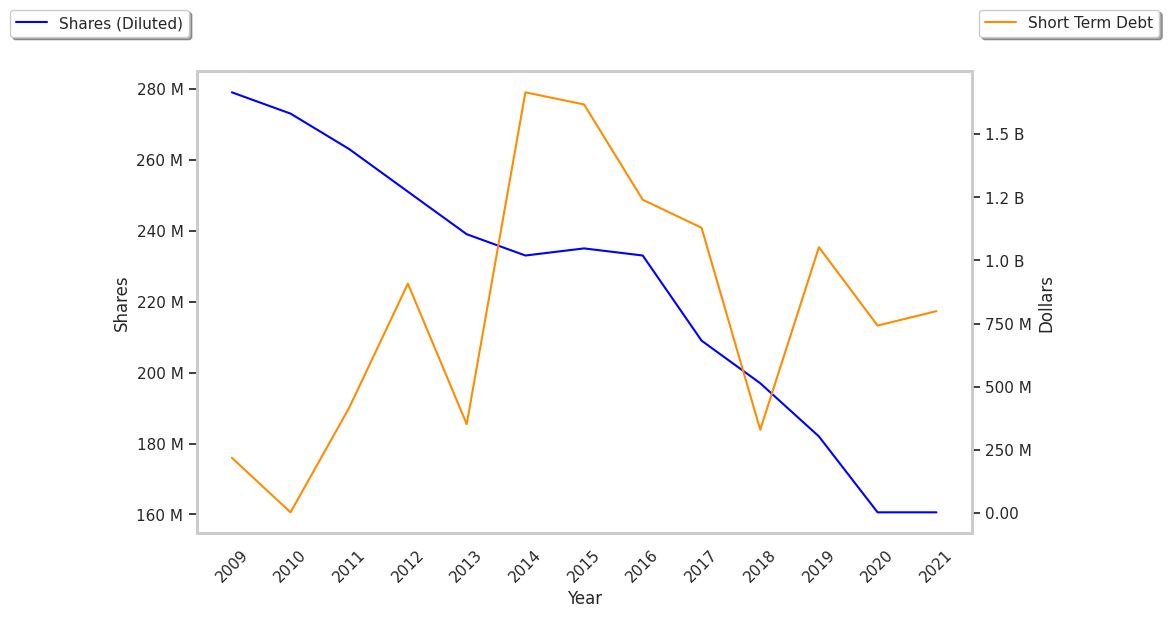
| Diluted Shares (M) | 160 | 152 | 141 | 133 | 127 | 128 |
| Earnings Per Share | $4.95 | -$28.26 | $7.23 | $25.03 | $22.39 | $25.72 |
| EPS Growth | n/a | -670.91% | 125.58% | 246.2% | -10.55% | 14.87% |
| Avg. Price | $128.44 | $148.89 | $196.34 | $294.9 | $462.98 | $663.1 |
| P/E Ratio | 25.79 | -5.27 | 26.82 | 11.69 | 20.54 | 25.64 |
| Free Cash Flow (M) | $4,012 | $4,091 | $4,046 | $4,769 | $3,883 | $5,548 |
| CAPEX (M) | $362 | $451 | $388 | $390 | $431 | $537 |
| EV / EBITDA | 8.8 | -5.73 | 13.82 | 9.63 | 15.26 | 18.04 |
| Total Debt (M) | $7,519 | $6,260 | $6,251 | $6,593 | $4,472 | $6,845 |
| Net Debt / EBITDA | 1.4 | -0.74 | 1.5 | 1.0 | 0.8 | 0.25 |
| Current Ratio | 1.01 | 0.98 | 0.93 | 0.92 | 0.88 | 0.9 |
McKesson has growing revenues and increasing reinvestment in the business and exceptional EPS growth. Additionally, the company's financial statements display generally positive cash flows and healthy leverage levels. However, the firm suffers from slimmer gross margins than its peers and not enough current assets to cover current liabilities because its current ratio is 0.9.