Sea logged a 19.2% change during today's afternoon session, and is now trading at a price of $174.35 per share.
Sea returned gains of 95.4% last year, with its stock price reaching a high of $178.0 and a low of $70.0. Over the same period, the stock outperformed the S&P 500 index by 78.1%. More recently, the company's 50-day average price was $156.61. Sea Limited, through its subsidiaries, operates as a consumer internet company in Southeast Asia, Latin America, the rest of Asia, and internationally. Based in Singapore, Singapore, the Large-Cap Consumer Discretionary company has 80,700 full time employees. Sea has not offered a dividend during the last year.
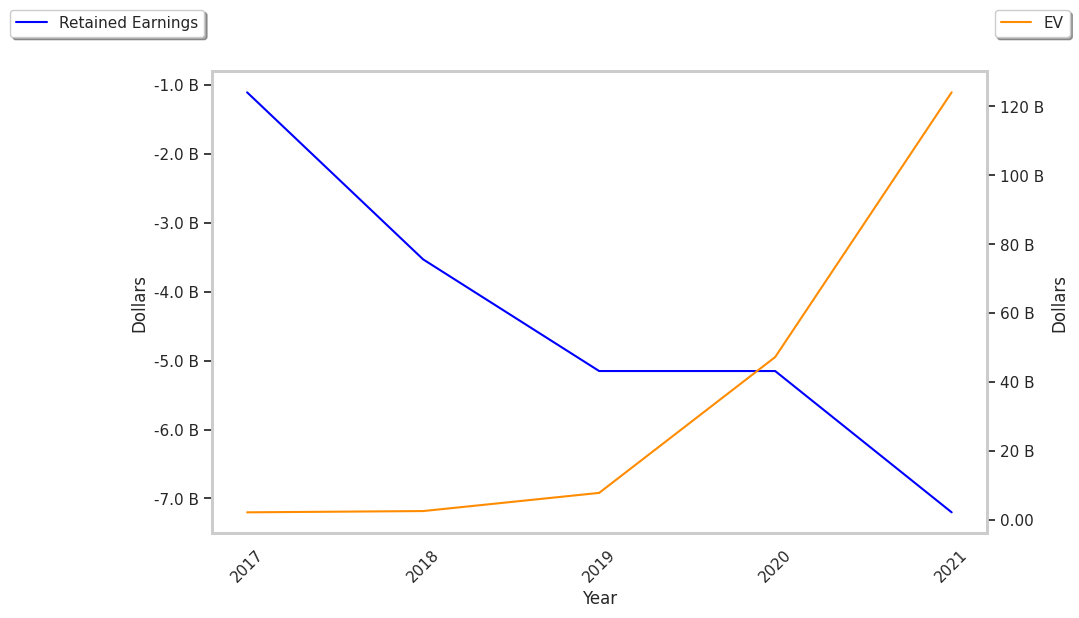
The Firm Has a Highly Leveraged Balance Sheet:
| 2019 | 2020 | 2021 | 2022 | 2023 | 2024 | |
|---|---|---|---|---|---|---|
| Revenue (M) | $2,175 | $4,376 | $9,955 | $12,450 | $13,064 | $16,820 |
| Gross Margins | 28% | 31% | 39% | 42% | 45% | 43% |
| Net Margins | -67% | -37% | -21% | -13% | 1% | 3% |
| Net Income (M) | -$1,463 | -$1,618 | -$2,047 | -$1,651 | $151 | $444 |
| Net Interest Expense (M) | $48 | $124 | $137 | $45 | $41 | $38 |
| Depreciation & Amort. (M) | $117 | $169 | $261 | $428 | $441 | $354 |
| Diluted Shares (M) | 437 | 477 | 533 | 558 | 594 | 605 |
| Earnings Per Share | -$3.35 | -$3.39 | -$3.84 | -$2.96 | $0.25 | $0.74 |
| EPS Growth | n/a | -1.19% | -13.27% | 22.92% | 108.45% | 196.0% |
| Avg. Price | $28.1 | $108.2 | $273.42 | $111.59 | $40.5 | $175.0 |
| P/E Ratio | -8.39 | -31.92 | -71.2 | -37.7 | 150.0 | 227.27 |
| Free Cash Flow (M) | -$170 | $220 | -$564 | -$1,980 | $1,838 | $2,959 |
| CAPEX (M) | $240 | $336 | $772 | $924 | $242 | $318 |
| EV / EBITDA | -14.57 | -45.38 | -112.19 | -59.03 | 39.39 | 106.09 |
| Total Debt (M) | $1,387 | $2,243 | $5,106 | $5,534 | $5,853 | $7,168 |
| Net Debt / EBITDA | 2.24 | 3.46 | 3.13 | 0.47 | 4.57 | 4.68 |
| Current Ratio | 1.87 | 1.93 | 2.11 | 1.83 | 1.44 | 1.49 |
Sea has rapidly growing revenues and a flat capital expenditure trend, generally positive cash flows, and positive EPS growth. However, the firm suffers from slimmer gross margins than its peers and a highly leveraged balance sheet. Finally, we note that Sea has just enough current assets to cover current liabilities, as shown by its current ratio of 1.49.
Sea's Valuation Is in Line With Its Sector Averages:
Sea has a trailing twelve month P/E ratio of 109.5, compared to an average of 20.93 for the Consumer Discretionary sector. Based on its EPS guidance of $2.11, the company has a forward P/E ratio of 74.2. The 7.2% compound average growth rate of Sea's historical and projected earnings per share yields a PEG ratio of 15.15. This suggests that these shares are overvalued. Furthermore, Sea is likely overvalued compared to the book value of its equity, since its P/B ratio of 11.48 is higher than the sector average of 2.93. The company's shares are currently trading 1048.6% below their Graham number. Ultimately, Sea's strong cash flows, decent earnings multiple, and healthy debt levels factor towards it being fairly valued, its elevated P/B ratio notwithstanding.
Sea Has an Analyst Consensus of Some Upside Potential:
The 32 analysts following Sea have set target prices ranging from $135.0 to $206.0 per share, for an average of $180.26 with a buy rating. The company is trading -3.3% away from its average target price, indicating that there is an analyst consensus of some upside potential.
Sea has an average amount of shares sold short because 7.5% of the company's shares are sold short. Institutions own 68.1% of the company's shares, and the insider ownership rate stands at 26.61%, suggesting a large amount of insider shareholders. The largest shareholder is BAILLIE GIFFORD & CO, whose 8% stake in the company is worth $7,257,137,790.