Today we're going to take a closer look at Large-Cap Finance company Intercontinental Exchange, whose shares are currently trading at $181.1. We've been asking ourselves whether the company is under or over valued at today's prices... let's perform a brief value analysis to find out!
Intercontinental Exchange's Valuation Is in Line With Its Sector Averages:
Intercontinental Exchange, Inc., together with its subsidiaries, provides technology and data to financial institutions, corporations, and government entities in the United States, the United Kingdom, the European Union, India, Israel, Canada, and Singapore. The company belongs to the Finance sector, which has an average price to earnings (P/E) ratio of 15.92 and an average price to book (P/B) ratio of 1.78. In contrast, Intercontinental Exchange has a trailing 12 month P/E ratio of 34.8 and a P/B ratio of 3.64.
Intercontinental Exchange has moved 17.1% over the last year compared to 18.2% for the S&P 500 -- a difference of -1.1%. Intercontinental Exchange has a 52 week high of $189.35 and a 52 week low of $142.29.
Growing Revenues but Not Enough Current Assets to Cover Current Liabilities:
| 2019 | 2020 | 2021 | 2022 | 2023 | 2024 | |
|---|---|---|---|---|---|---|
| Revenue (M) | $6,547 | $8,244 | $9,168 | $9,636 | $9,903 | $11,761 |
| Interest Income (M) | $285 | $357 | $423 | $616 | $808 | $870 |
| Operating Margins | 41% | 37% | 38% | 38% | 37% | 37% |
| Net Margins | 30% | 25% | 44% | 15% | 24% | 23% |
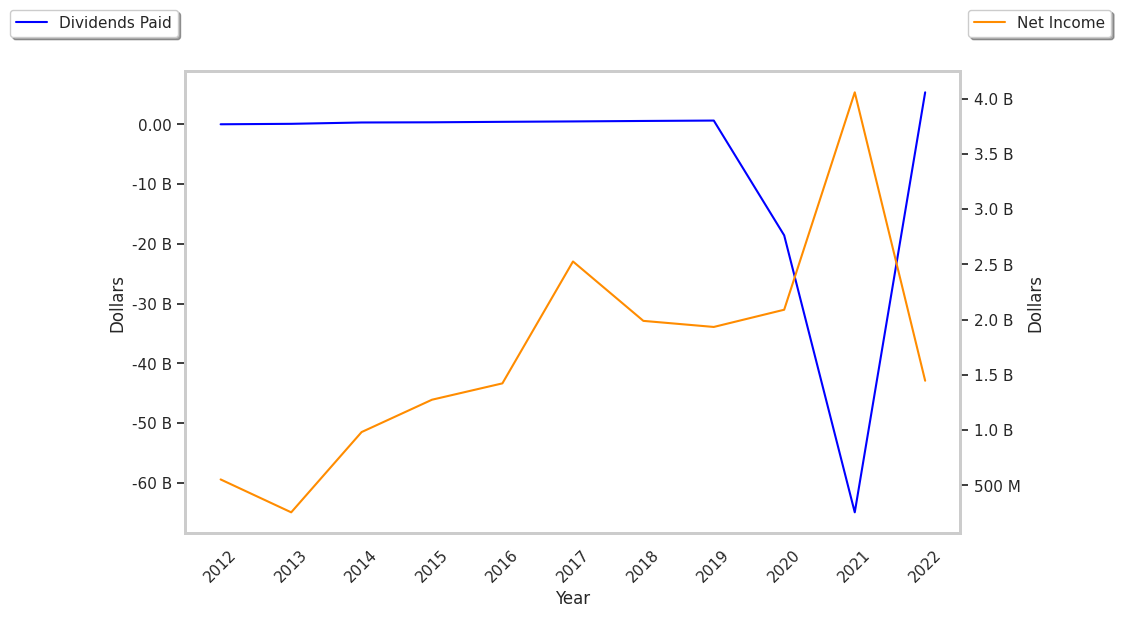
| Net Income (M) | $1,933 | $2,089 | $4,058 | $1,446 | $2,368 | $2,754 |
| Depreciation & Amort. (M) | $662 | $751 | $1,009 | $1,031 | $1,215 | $201 |
| Diluted Shares (M) | 565 | 555 | 565 | 561 | 565 | 576 |
| Earnings Per Share | $3.42 | $3.76 | $7.18 | $2.58 | $4.19 | $4.78 |
| EPS Growth | n/a | 9.94% | 90.96% | -64.07% | 62.4% | 14.08% |
| Avg. Price | $80.89 | $92.41 | $116.67 | $114.83 | $128.43 | $182.74 |
| P/E Ratio | 23.79 | 24.51 | 16.16 | 44.68 | 30.29 | 37.99 |
| Free Cash Flow (M) | $2,506 | $2,674 | $2,944 | $3,329 | $3,352 | $4,203 |
| CAPEX (M) | $153 | $207 | $179 | $225 | $190 | $406 |
| EV / EBITDA | 16.65 | 18.37 | 18.03 | 17.32 | 19.12 | 27.53 |
| Total Debt (M) | $10,388 | $18,948 | $15,439 | $18,126 | $22,613 | $20,368 |
| Net Debt / EBITDA | 2.86 | 4.85 | 3.33 | 3.5 | 4.5 | 4.33 |
| Current Ratio | 0.99 | 0.99 | 1.01 | 1.05 | 1.0 | 0.99 |
Intercontinental Exchange has growing revenues and increasing reinvestment in the business and generally positive cash flows. Additionally, the company's financial statements display strong operating margins with a stable trend and positive EPS growth. However, the firm has not enough current assets to cover current liabilities because its current ratio is 0.99. Finally, we note that Intercontinental Exchange has significant leverage levels.