General Motors logged a 1.3% change during today's afternoon session, and is now trading at a price of $56.3 per share.
General Motors returned gains of 23.9% last year, with its stock price reaching a high of $61.24 and a low of $41.6. Over the same period, the stock outperformed the S&P 500 index by 7.2%. More recently, the company's 50-day average price was $51.25. General Motors Company designs, builds, and sells trucks, crossovers, cars, and automobile parts worldwide. Based in Detroit, MI, the Large-Cap Consumer Discretionary company has 162,000 full time employees. General Motors has offered a 0.9% dividend yield over the last 12 months.
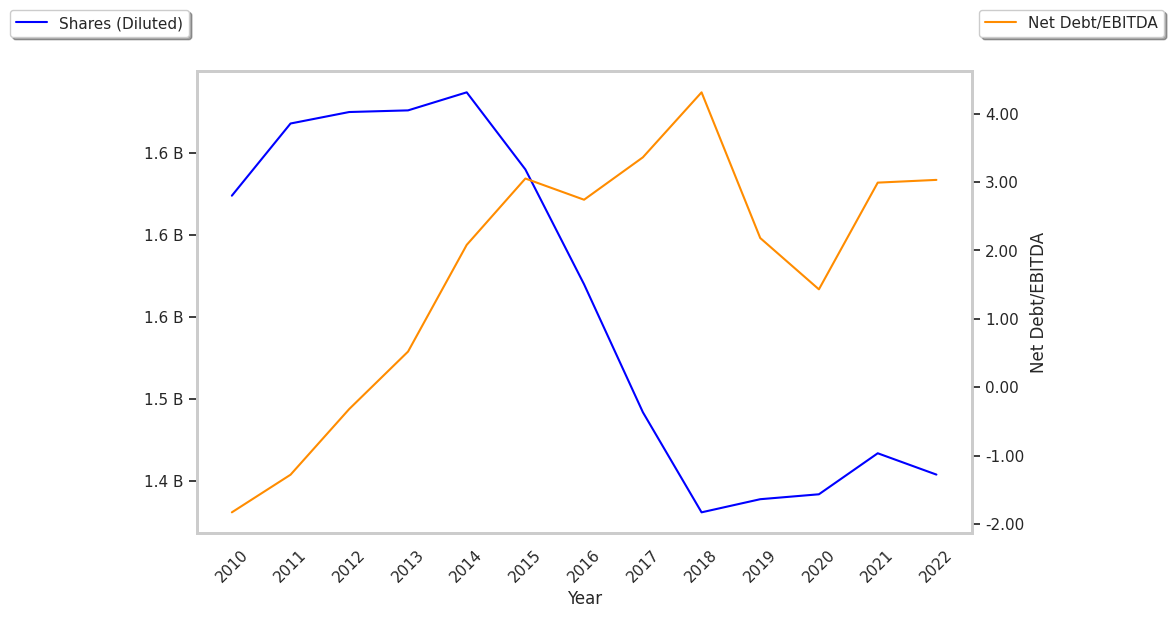
EPS Trend Sustained Primarily by Reducing the Number of Shares Outstanding:
| 2019 | 2020 | 2021 | 2022 | 2023 | 2024 | |
|---|---|---|---|---|---|---|
| Revenue (M) | $137,237 | $122,485 | $127,004 | $156,735 | $171,842 | $187,442 |
| Operating Margins | 4% | 5% | 7% | 7% | 5% | 7% |
| Net Margins | 5% | 5% | 8% | 6% | 6% | 3% |
| Net Income (M) | $6,732 | $6,427 | $10,019 | $9,934 | $10,127 | $6,008 |
| Net Interest Expense (M) | $1,469 | $4,121 | $3,041 | $1,432 | $1,537 | $6,183 |
| Depreciation & Amort. (M) | $14,060 | $12,676 | $12,047 | $11,276 | $11,737 | $11,456 |
| Diluted Shares (M) | 1,439 | 1,442 | 1,468 | 1,454 | 1,369 | 1,129 |
| Earnings Per Share | $4.57 | $4.33 | $6.7 | $6.13 | $7.32 | $6.37 |
| EPS Growth | n/a | -5.25% | 54.73% | -8.51% | 19.41% | -12.98% |
| Avg. Price | $35.91 | $30.12 | $55.35 | $42.86 | $35.92 | $56.3 |
| P/E Ratio | 7.77 | 6.91 | 8.16 | 6.95 | 4.89 | 8.73 |
| Free Cash Flow (M) | $7,429 | $11,370 | $7,679 | $6,805 | $9,960 | $9,299 |
| CAPEX (M) | $7,592 | $5,300 | $7,509 | $9,238 | $10,970 | $10,830 |
| EV / EBITDA | 24.87 | 25.46 | 24.73 | 25.46 | 23.61 | 21.2 |
| Total Debt (M) | $454,447 | $468,621 | $468,904 | $506,545 | $465,293 | $468,723 |
| Net Debt / EBITDA | 22.28 | 23.23 | 21.0 | 22.57 | 21.22 | 18.52 |
| Current Ratio | 0.88 | 1.01 | 1.1 | 1.1 | 1.08 | 1.13 |
General Motors has weak operating margins with a positive growth rate, positive cash flows, and just enough current assets to cover current liabilities, as shown by its current ratio of 1.13. We also note that the company has growing revenues and increasing reinvestment in the business working in its favor. However, the firm suffers from EPS growth achieved by reducing the number of outstanding shares and a highly leveraged balance sheet.
General Motors Is Potentially Undervalued and Its Shares Are on Sale:
General Motors has a trailing twelve month P/E ratio of 7.8, compared to an average of 20.93 for the Consumer Discretionary sector. Based on its EPS guidance of $10.57, the company has a forward P/E ratio of 4.8. The 12.7% compound average growth rate of General Motors's historical and projected earnings per share yields a PEG ratio of 0.61. This suggests that its shares are undervalued. Additionally, the market is possibly undervaluing General Motors in terms of its equity because its P/B ratio is 0.81 whereas the sector average is 2.93. The company's shares are currently trading -37.1% above their Graham number.
General Motors Has an Average Rating of Buy:
The 27 analysts following General Motors have set target prices ranging from $38.0 to $80.0 per share, for an average of $57.1 with a buy rating. The company is trading -1.4% away from its average target price, indicating that there is an analyst consensus of some upside potential.
General Motors has an average amount of shares sold short because 2.0% of the company's shares are sold short. Institutions own 85.5% of the company's shares, and the insider ownership rate stands at 0.24%, suggesting a small amount of insider investors. The largest shareholder is Vanguard Group Inc, whose 12% stake in the company is worth $6,235,771,194.