Coca-Cola logged a -1.2% change during today's afternoon session, and is now trading at a price of $69.6 per share.
Over the last year, Coca-Cola logged a 2.6% change, with its stock price reaching a high of $74.38 and a low of $60.62. Over the same period, the stock underperformed the S&P 500 index by -14.0%. AThe company's 50-day average price was $70.11. The Coca-Cola Company, a beverage company, manufactures and sells various nonalcoholic beverages in the United States and internationally. Based in Atlanta, GA, the Large-Cap Consumer Staples company has 69,700 full time employees. Coca-Cola has offered a 2.8% dividend yield over the last 12 months.
Positive Cash Flows:
| 2019 | 2020 | 2021 | 2022 | 2023 | 2024 | |
|---|---|---|---|---|---|---|
| Revenue (M) | $37,266 | $33,014 | $38,655 | $43,004 | $45,754 | $47,061 |
| Gross Margins | 61% | 59% | 60% | 57% | 60% | 61% |
| Net Margins | 24% | 23% | 25% | 22% | 23% | 23% |
| Net Income (M) | $8,920 | $7,747 | $9,771 | $9,542 | $10,714 | $10,631 |
| Net Interest Expense (M) | $946 | $1,437 | $1,597 | $882 | $1,527 | $1,656 |
| Depreciation & Amort. (M) | $1,365 | $1,536 | $1,452 | $1,260 | $1,128 | $997 |
| Diluted Shares (M) | 4,314 | 4,323 | 4,340 | 4,350 | 4,339 | 4,320 |
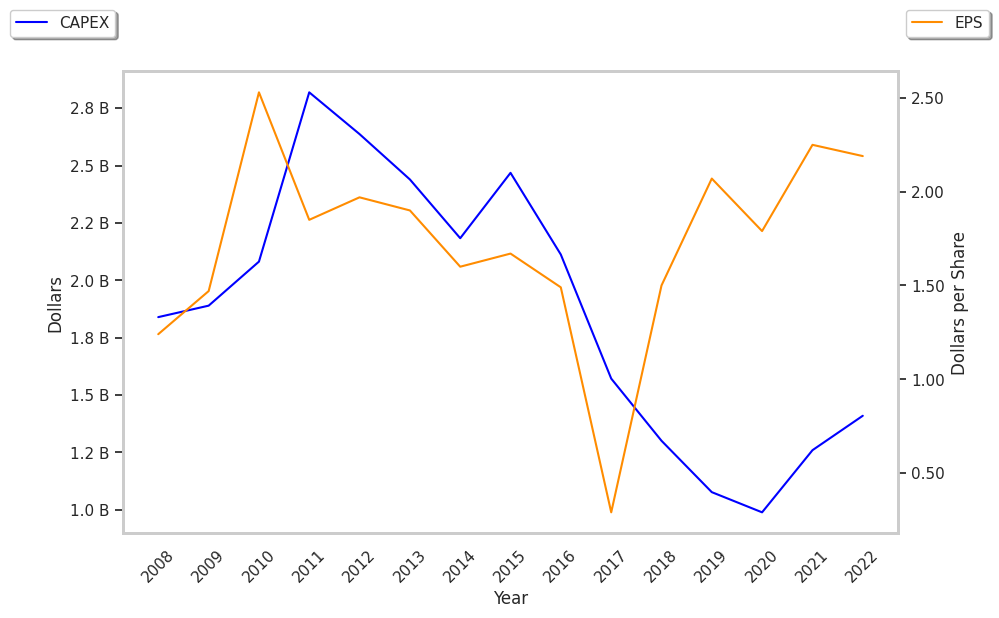
| Earnings Per Share | $2.07 | $1.79 | $2.25 | $2.19 | $2.47 | $2.46 |
| EPS Growth | n/a | -13.53% | 25.7% | -2.67% | 12.79% | -0.4% |
| Avg. Price | $44.84 | $45.47 | $50.87 | $59.81 | $58.93 | $69.49 |
| P/E Ratio | 21.45 | 25.26 | 22.51 | 27.19 | 23.76 | 28.13 |
| Free Cash Flow (M) | $8,417 | $8,667 | $11,258 | $9,534 | $9,747 | $4,741 |
| CAPEX (M) | $2,054 | $1,177 | $1,367 | $1,484 | $1,852 | $2,064 |
| EV / EBITDA | 19.32 | 21.78 | 21.29 | 23.58 | 22.92 | 29.66 |
| Total Debt (M) | $36,022 | $41,095 | $40,792 | $37,175 | $39,467 | $37,144 |
| Net Debt / EBITDA | 2.58 | 3.26 | 2.65 | 2.27 | 2.42 | 2.39 |
| Current Ratio | 0.76 | 1.32 | 1.13 | 1.15 | 1.13 | 1.03 |
Coca-Cola has growing revenues and a flat capital expenditure trend, positive EPS growth, and healthy leverage levels. However, the firm has positive cash flows. Finally, we note that Coca-Cola has just enough current assets to cover current liabilities, as shown by its current ratio of 1.03.
a Very Low P/E Ratio but Priced Beyond Its Margin of Safety:
Coca-Cola has a trailing twelve month P/E ratio of 24.9, compared to an average of 25.91 for the Consumer Staples sector. Based on its EPS guidance of $2.97, the company has a forward P/E ratio of 23.6. The 5.3% compound average growth rate of Coca-Cola's historical and projected earnings per share yields a PEG ratio of 4.7. This suggests that these shares are overvalued. Furthermore, Coca-Cola is likely overvalued compared to the book value of its equity, since its P/B ratio of 10.48 is higher than the sector average of 3.03. The company's shares are currently trading 289.9% below their Graham number. Ultimately, Coca-Cola's strong cash flows, decent earnings multiple, and healthy debt levels factor towards it being fairly valued, its elevated P/B ratio notwithstanding.
Coca-Cola Has an Average Rating of Buy:
The 24 analysts following Coca-Cola have set target prices ranging from $70.0 to $85.0 per share, for an average of $78.76 with a buy rating. The company is trading -11.6% away from its average target price, indicating that there is an analyst consensus of some upside potential.
Coca-Cola has a very low short interest because 0.8% of the company's shares are sold short. Institutions own 65.2% of the company's shares, and the insider ownership rate stands at 9.88%, suggesting a large amount of insider shareholders. The largest shareholder is Berkshire Hathaway, Inc, whose 9% stake in the company is worth $27,839,999,389.