It's been a great afternoon session for Delta Air Lines investors, who saw their shares rise 2.2% to a price of $60.24 per share. At these higher prices, is the company still fairly valued? If you are thinking about investing, make sure to check the company's fundamentals before making a decision.
Delta Air Lines Is Potentially Undervalued and Priced Fairly:
Delta Air Lines, Inc. provides scheduled air transportation for passengers and cargo in the United States and internationally. The company belongs to the Consumer Discretionary sector, which has an average price to earnings (P/E) ratio of 20.93 and an average price to book (P/B) ratio of 2.93. In contrast, Delta Air Lines has a trailing 12 month P/E ratio of 8.8 and a P/B ratio of 2.24.
Delta Air Lines has moved 48.9% over the last year compared to 15.0% for the S&P 500 -- a difference of 33.8%. Delta Air Lines has a 52 week high of $69.98 and a 52 week low of $34.74.
Increasing Revenues but Narrowing Margins:
| 2019 | 2020 | 2021 | 2022 | 2023 | 2024 | |
|---|---|---|---|---|---|---|
| Revenue (M) | $47,007 | $17,095 | $29,899 | $50,582 | $58,048 | $61,643 |
| Gross Margins | 75% | 47% | 67% | 76% | 75% | 74% |
| Net Margins | 10% | -72% | 1% | 3% | 8% | 6% |
| Net Income (M) | $4,767 | -$12,385 | $280 | $1,318 | $4,609 | $3,457 |
| Net Interest Expense (M) | -$301 | -$929 | -$1,279 | -$1,029 | -$834 | -$747 |
| Depreciation & Amort. (M) | $2,581 | $2,312 | $1,998 | $2,107 | $2,341 | $2,513 |
| Diluted Shares (M) | 653 | 636 | 641 | 641 | 643 | 648 |
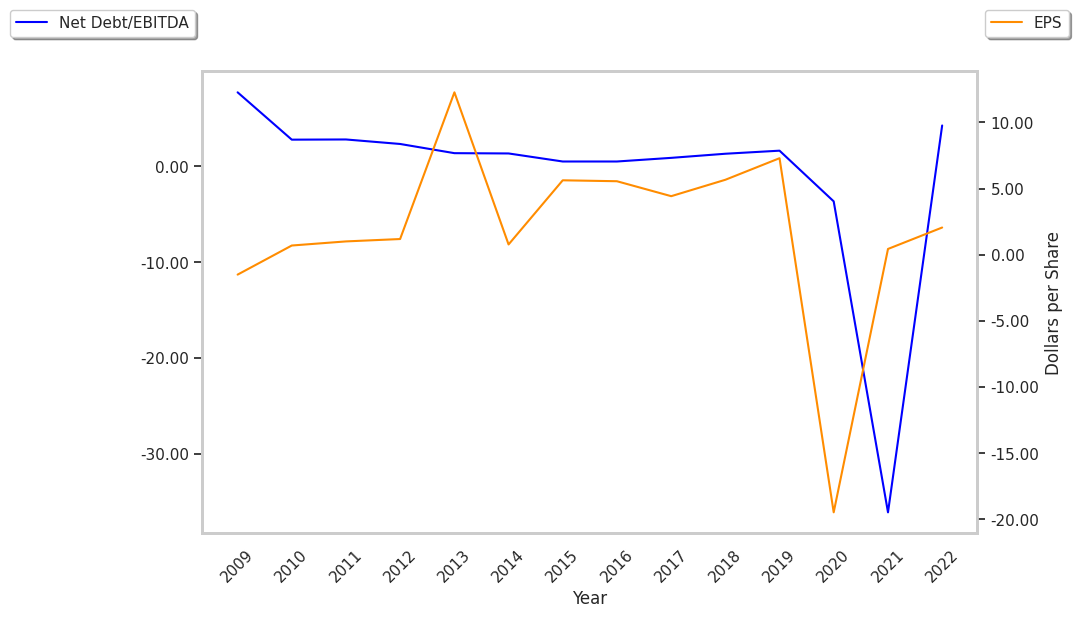
| Earnings Per Share | $7.3 | -$19.49 | $0.44 | $2.06 | $7.17 | $5.33 |
| EPS Growth | n/a | -366.99% | 102.26% | 368.18% | 248.06% | -25.66% |
| Avg. Price | $54.26 | $34.93 | $42.82 | $38.19 | $40.23 | $60.24 |
| P/E Ratio | 7.41 | -1.79 | 97.32 | 18.45 | 5.58 | 11.18 |
| Free Cash Flow (M) | $6,833 | -$4,796 | $1,613 | $4,492 | $4,786 | $2,885 |
| CAPEX (M) | $1,592 | $1,003 | $1,651 | $1,871 | $1,678 | $5,140 |
| EV / EBITDA | 4.9 | -4.25 | 11.92 | 7.66 | 5.48 | 6.25 |
| Total Debt (M) | $11,160 | $29,157 | $26,920 | $23,030 | $20,054 | $17,522 |
| Net Debt / EBITDA | 0.9 | -2.05 | 4.89 | 3.43 | 2.2 | 1.7 |
| Current Ratio | 0.41 | 1.09 | 0.76 | 0.5 | 0.39 | 0.37 |
Delta Air Lines has declining EPS growth, positive cash flows, and not enough current assets to cover current liabilities because its current ratio is 0.37. On the other hand, the company benefits from growing revenues and increasing reinvestment in the business and healthy leverage levels. Furthermore, Delta Air Lines has similar gross margins to its peers.