We've been asking ourselves recently if the market has placed a fair valuation on Sea. Let's dive into some of the fundamental values of this Large-Cap Consumer Discretionary company to determine if there might be an opportunity here for value-minded investors.
Sea Has Elevated P/B and P/E Ratios:
Sea Limited, through its subsidiaries, operates as a consumer internet company in Southeast Asia, Latin America, the rest of Asia, and internationally. The company belongs to the Consumer Discretionary sector, which has an average price to earnings (P/E) ratio of 20.93 and an average price to book (P/B) ratio of 2.93. In contrast, Sea has a trailing 12 month P/E ratio of 91.2 and a P/B ratio of 10.78.
Sea has moved 115.6% over the last year compared to 15.0% for the S&P 500 -- a difference of 100.6%. Sea has a 52 week high of $181.76 and a 52 week low of $75.67.
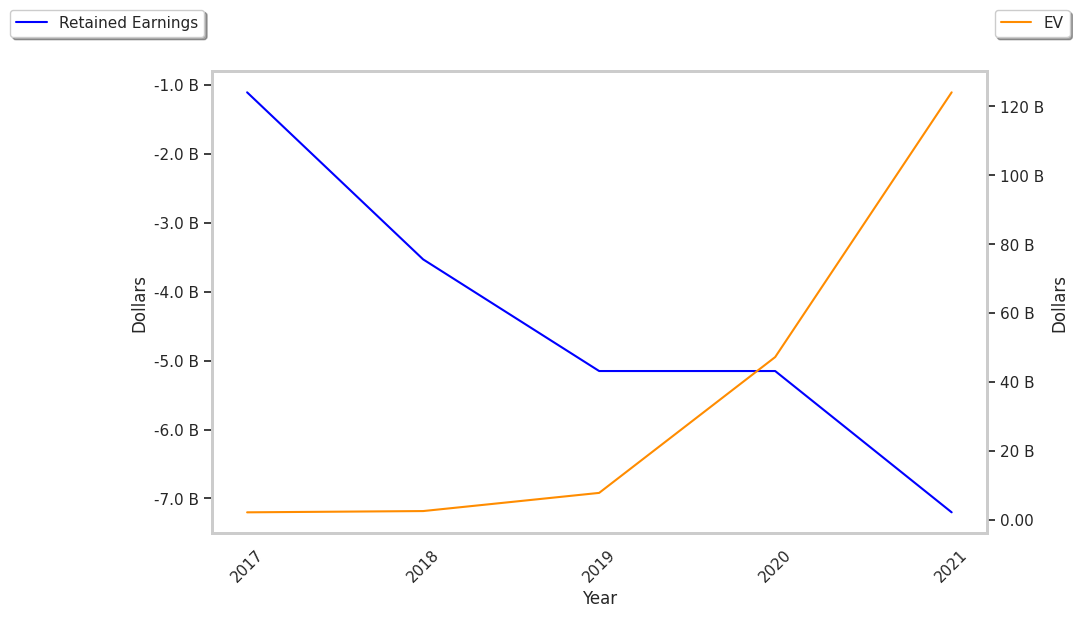
The Firm Has a Highly Leveraged Balance Sheet:
| 2019 | 2020 | 2021 | 2022 | 2023 | 2024 | |
|---|---|---|---|---|---|---|
| Revenue (M) | $2,175 | $4,376 | $9,955 | $12,450 | $13,064 | $16,820 |
| Gross Margins | 28% | 31% | 39% | 42% | 45% | 43% |
| Net Margins | -67% | -37% | -21% | -13% | 1% | 3% |
| Net Income (M) | -$1,463 | -$1,618 | -$2,047 | -$1,651 | $151 | $444 |
| Net Interest Expense (M) | $48 | $124 | $137 | $45 | $41 | $38 |
| Depreciation & Amort. (M) | $117 | $169 | $261 | $428 | $441 | $354 |
| Diluted Shares (M) | 437 | 477 | 533 | 558 | 594 | 605 |
| Earnings Per Share | -$3.35 | -$3.39 | -$3.84 | -$2.96 | $0.25 | $0.74 |
| EPS Growth | n/a | -1.19% | -13.27% | 22.92% | 108.45% | 196.0% |
| Avg. Price | $28.1 | $108.2 | $273.42 | $111.59 | $40.5 | $177.28 |
| P/E Ratio | -8.39 | -31.92 | -71.2 | -37.7 | 150.0 | 230.23 |
| Free Cash Flow (M) | -$170 | $220 | -$564 | -$1,980 | $1,838 | $2,959 |
| CAPEX (M) | $240 | $336 | $772 | $924 | $242 | $318 |
| EV / EBITDA | -14.57 | -45.38 | -112.19 | -59.03 | 39.39 | 107.41 |
| Total Debt (M) | $1,387 | $2,243 | $5,106 | $5,534 | $5,853 | $7,168 |
| Net Debt / EBITDA | 2.24 | 3.46 | 3.13 | 0.47 | 4.57 | 4.68 |
| Current Ratio | 1.87 | 1.93 | 2.11 | 1.83 | 1.44 | 1.49 |
Sea has rapidly growing revenues and a flat capital expenditure trend, generally positive cash flows, and positive EPS growth. However, the firm suffers from slimmer gross margins than its peers and a highly leveraged balance sheet. Finally, we note that Sea has just enough current assets to cover current liabilities, as shown by its current ratio of 1.49.