Today we're going to take a closer look at Large-Cap Utilities company American Electric Power, whose shares are currently trading at $111.31. We've been asking ourselves whether the company is under or over valued at today's prices... let's perform a brief value analysis to find out!
a Very Low P/E Ratio but Trades Above Its Graham Number:
American Electric Power Company, Inc., an electric public utility holding company, engages in the generation, transmission, and distribution of electricity for sale to retail and wholesale customers in the United States. The company belongs to the Utilities sector, which has an average price to earnings (P/E) ratio of 21.16 and an average price to book (P/B) ratio of 2.36. In contrast, American Electric Power has a trailing 12 month P/E ratio of 16.3 and a P/B ratio of 1.99.
American Electric Power has moved 13.4% over the last year compared to 15.2% for the S&P 500 -- a difference of -1.8%. American Electric Power has a 52 week high of $115.36 and a 52 week low of $89.91.
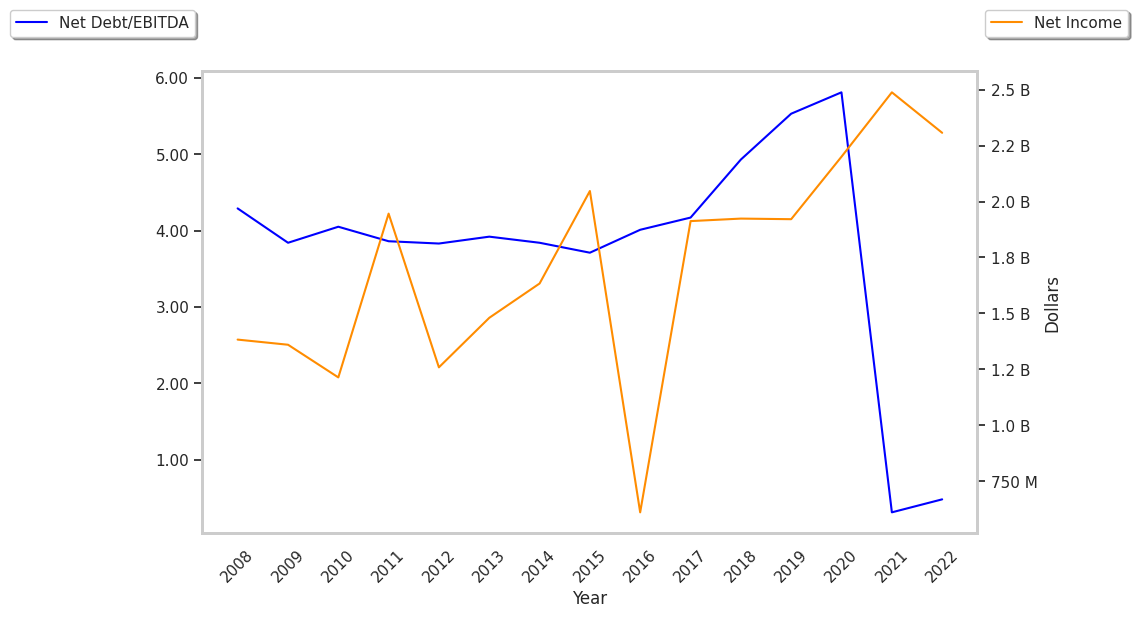
The Company May Be Profitable, but Its Balance Sheet Is Highly Leveraged:
| 2019 | 2020 | 2021 | 2022 | 2023 | 2024 | |
|---|---|---|---|---|---|---|
| Revenue (M) | $15,561 | $14,918 | $16,792 | $19,640 | $18,982 | $19,721 |
| Operating Margins | 17% | 20% | 20% | 18% | 19% | 22% |
| Net Margins | 12% | 15% | 15% | 12% | 12% | 15% |
| Net Income (M) | $1,920 | $2,197 | $2,488 | $2,306 | $2,213 | $2,976 |
| Net Interest Expense (M) | $1,072 | $1,166 | $1,199 | $1,396 | $1,807 | $1,838 |
| Depreciation & Amort. (M) | $2,514 | $2,683 | $2,826 | $3,203 | $3,090 | $3,149 |
| Diluted Shares (M) | 495 | 497 | 502 | 513 | 520 | 531 |
| Earnings Per Share | $3.88 | $4.42 | $4.96 | $4.49 | $4.24 | $5.58 |
| EPS Growth | n/a | 13.92% | 12.22% | -9.48% | -5.57% | 31.6% |
| Avg. Price | $76.41 | $77.83 | $79.02 | $91.28 | $81.22 | $110.7 |
| P/E Ratio | 19.64 | 17.53 | 15.9 | 20.24 | 19.07 | 19.77 |
| Free Cash Flow (M) | $4,273 | $3,833 | -$1,820 | -$1,384 | -$2,366 | -$826 |
| CAPEX (M) | $3 | n/a | $5,660 | $6,672 | $7,378 | $7,631 |
| EV / EBITDA | 12.58 | 12.23 | 11.86 | 13.06 | 12.42 | 13.95 |
| Total Debt (M) | $26,744 | $31,108 | $34,558 | $40,913 | $40,148 | $45,167 |
| Net Debt / EBITDA | 5.19 | 5.42 | 5.48 | 6.04 | 5.99 | 6.03 |
| Current Ratio | 0.4 | 0.44 | 0.46 | 0.51 | 0.53 | 0.44 |
American Electric Power has growing revenues and increasing reinvestment in the business, decent operating margins with a stable trend, and positive EPS growth. However, American Electric Power has positive cash flows, not enough current assets to cover current liabilities because its current ratio is 0.44, and a highly leveraged balance sheet.