Today we're going to take a closer look at Large-Cap Energy company Chevron, whose shares are currently trading at $152.22. We've been asking ourselves whether the company is under or over valued at today's prices... let's perform a brief value analysis to find out!
Chevron's Valuation Is in Line With Its Sector Averages:
Chevron Corporation, through its subsidiaries, engages in the integrated energy and chemicals operations in the United States and internationally. The company belongs to the Energy sector, which has an average price to earnings (P/E) ratio of 18.35 and an average price to book (P/B) ratio of 1.6. In contrast, Chevron has a trailing 12 month P/E ratio of 19.6 and a P/B ratio of 1.8.
Chevron has moved 7.3% over the last year compared to 15.2% for the S&P 500 — a difference of -7.9%. Chevron has a 52 week high of $168.96 and a 52 week low of $132.04.
Growing Revenues but an Average Current Ratio:
| 2019 | 2020 | 2021 | 2022 | 2023 | 2024 | |
|---|---|---|---|---|---|---|
| Revenue (M) | $146,516 | $94,692 | $162,465 | $246,252 | $200,949 | $202,792 |
| Operating Margins | 4% | -8% | 13% | 20% | 15% | 14% |
| Net Margins | 2% | -6% | 10% | 14% | 11% | 9% |
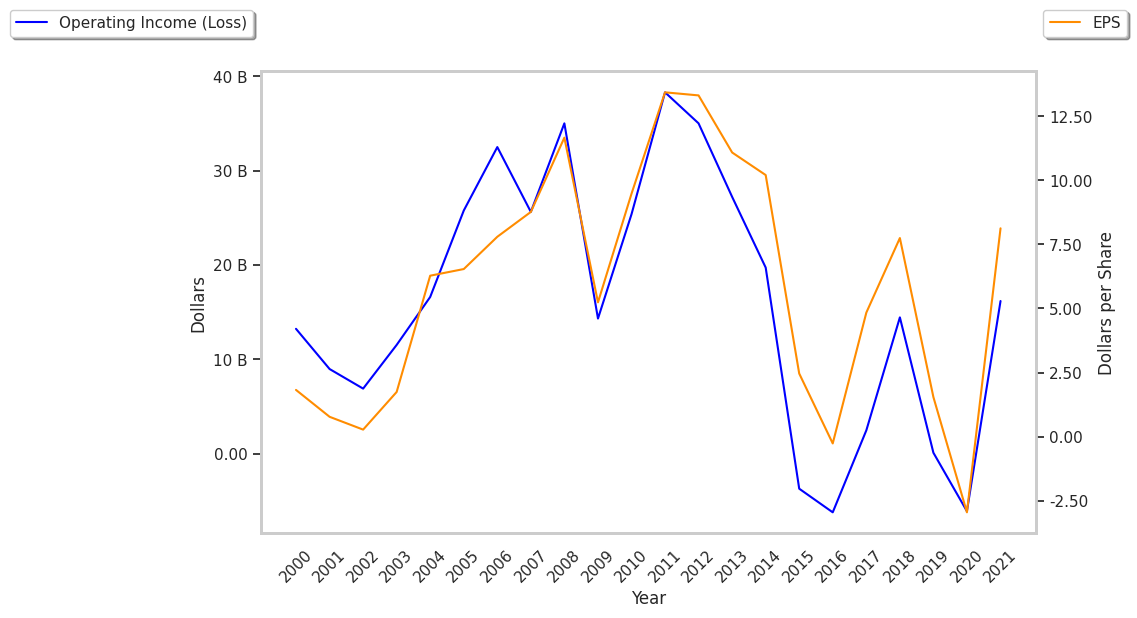
| Net Income (M) | $2,924 | -$5,543 | $15,625 | $35,465 | $21,369 | $17,661 |
| Net Interest Expense (M) | $798 | $697 | $712 | $516 | $469 | $594 |
| Depreciation & Amort. (M) | $29,218 | $19,508 | $17,925 | $16,319 | $17,326 | $17,282 |
| Diluted Shares (M) | 1,895 | 1,870 | 1,920 | 1,940 | 1,880 | 1,817 |
| Earnings Per Share | $1.54 | -$2.96 | $8.14 | $18.28 | $11.36 | $9.72 |
| EPS Growth | n/a | -292.21% | 375.0% | 124.57% | -37.86% | -14.44% |
| Avg. Price | $99.89 | $77.09 | $96.37 | $147.4 | $149.16 | $152.02 |
| P/E Ratio | 64.45 | -26.04 | 11.82 | 8.03 | 13.07 | 15.58 |
| Free Cash Flow (M) | $13,198 | $1,655 | $21,131 | $37,628 | $19,780 | $15,044 |
| CAPEX (M) | $14,116 | $8,922 | $8,056 | $11,974 | $15,829 | $16,448 |
| EV / EBITDA | 6.36 | 15.06 | 5.54 | 4.5 | 6.43 | 6.95 |
| Total Debt (M) | $31,762 | $37,049 | $33,691 | $27,389 | $25,379 | $32,791 |
| Net Debt / EBITDA | 0.9 | 3.04 | 0.84 | 0.15 | 0.37 | 0.64 |
| Current Ratio | 1.07 | 1.18 | 1.26 | 1.47 | 1.27 | 1.06 |
Chevron benefits from growing revenues and increasing reinvestment in the business, exceptional EPS growth, and decent operating margins with a positive growth rate. The company's financial statements show generally positive cash flows and healthy leverage levels. Furthermore, Chevron has just enough current assets to cover current liabilities, as shown by its current ratio of 1.06.