It's been a great afternoon session for Thermo Fisher Scientific Inc investors, who saw their shares rise 2.1% to a price of $497.98 per share. At these higher prices, is the company still fairly valued? If you are thinking about investing, make sure to check the company's fundamentals before making a decision.
Forward Earnings Expected to Increase but Priced at a Premium:
Thermo Fisher Scientific Inc. provides life sciences solutions, analytical instruments, specialty diagnostics, and laboratory products and biopharma services in the North America, Europe, Asia-Pacific, and internationally. The company belongs to the Industrials sector, which has an average price to earnings (P/E) ratio of 24.03 and an average price to book (P/B) ratio of 2.89. In contrast, Thermo Fisher Scientific Inc has a trailing 12 month P/E ratio of 28.8 and a P/B ratio of 3.72.
Thermo Fisher Scientific Inc has moved -20.7% over the last year compared to 15.2% for the S&P 500 — a difference of -35.9%. Thermo Fisher Scientific Inc has a 52 week high of $627.88 and a 52 week low of $385.46.
Growing Revenues but Significant Leverage Levels:
| 2019 | 2020 | 2021 | 2022 | 2023 | 2024 | |
|---|---|---|---|---|---|---|
| Revenue (M) | $25,542 | $32,218 | $39,211 | $44,915 | $42,857 | $42,879 |
| Operating Margins | 18% | 24% | 26% | 19% | 16% | 17% |
| Net Margins | 14% | 20% | 20% | 15% | 14% | 15% |
| Net Income (M) | $3,696 | $6,375 | $7,728 | $6,960 | $5,955 | $6,338 |
| Net Interest Expense (M) | $676 | $553 | $536 | $726 | $1,375 | $1,570 |
| Depreciation & Amort. (M) | $564 | $658 | $831 | $986 | $1,068 | $1,156 |
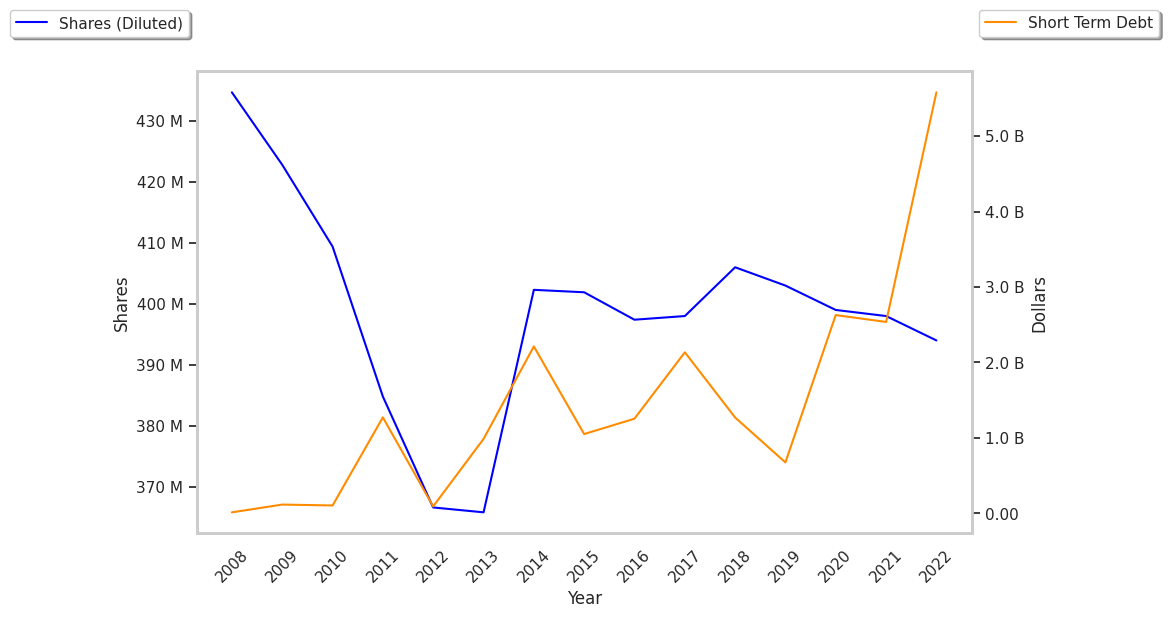
| Diluted Shares (M) | 403 | 399 | 397 | 394 | 388 | 383 |
| Earnings Per Share | $9.17 | $15.96 | $19.46 | $17.63 | $15.45 | $16.53 |
| EPS Growth | n/a | 74.05% | 21.93% | -9.4% | -12.37% | 6.99% |
| Avg. Price | $276.26 | $381.32 | $529.06 | $560.27 | $530.79 | $496.54 |
| P/E Ratio | 29.9 | 23.7 | 26.97 | 31.56 | 34.2 | 29.95 |
| Free Cash Flow (M) | $4,047 | $6,815 | $6,789 | $6,911 | $6,927 | $7,267 |
| CAPEX (M) | $926 | $1,474 | $2,523 | $2,243 | $1,479 | $1,400 |
| EV / EBITDA | 24.48 | 19.65 | 21.98 | 26.14 | 29.19 | 25.74 |
| Total Debt (M) | $18,428 | $24,356 | $34,870 | $34,488 | $34,917 | $33,286 |
| Net Debt / EBITDA | 3.11 | 1.66 | 2.8 | 2.77 | 3.39 | 3.45 |
| Current Ratio | 1.92 | 2.13 | 1.5 | 1.48 | 1.75 | 1.66 |
Thermo Fisher Scientific Inc has growing revenues and increasing reinvestment in the business and generally positive cash flows. Additionally, the company's financial statements display a strong EPS growth trend and a decent current ratio of 1.66. Furthermore, Thermo Fisher Scientific Inc has decent operating margins with a stable trend and significant leverage levels.