Now trading at a price of $75.08, Canadian Pacific Railway has moved 0.3% so far today.
Canadian Pacific Railway returned losses of -6.3% last year, with its stock price reaching a high of $87.72 and a low of $66.49. Over the same period, the stock underperformed the S&P 500 index by -20.3%. AThe company's 50-day average price was $78.19. Canadian Pacific Kansas City Limited, together with its subsidiaries, owns and operates a transcontinental freight railway in Canada, the United States, and Mexico. Based in Calgary, Canada, the Large-Cap Industrials company has 19,943 full time employees. Canadian Pacific Railway has offered a 1.1% dividend yield over the last 12 months.
Strong Revenue Growth but Not Enough Current Assets to Cover Current Liabilities:
| 2019 | 2020 | 2021 | 2022 | 2023 | 2024 | |
|---|---|---|---|---|---|---|
| Revenue (M) | $7,792 | $7,710 | $7,995 | $8,814 | $12,555 | $14,546 |
| Operating Margins | 40% | 43% | 40% | 38% | 35% | 36% |
| Net Margins | 31% | 32% | 36% | 40% | 31% | 26% |
| Net Income (M) | $2,440 | $2,444 | $2,852 | $3,517 | $3,927 | $3,718 |
| Net Interest Expense (M) | -$448 | -$458 | -$440 | -$652 | -$771 | -$801 |
| Depreciation & Amort. (M) | $706 | $779 | $811 | $853 | $1,543 | $1,900 |
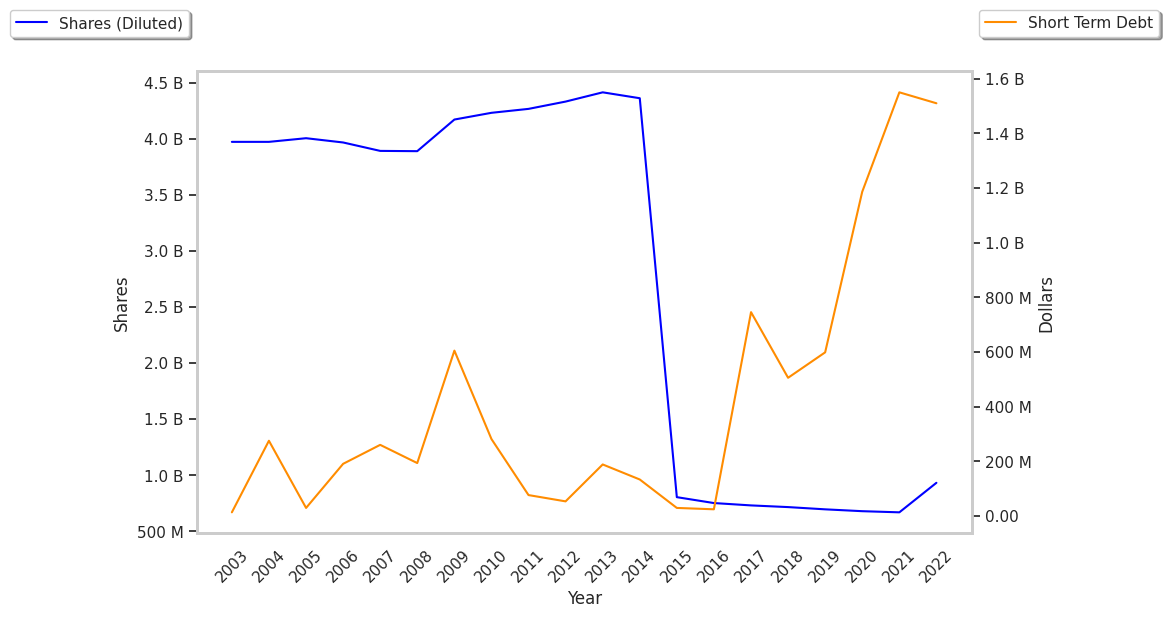
| Diluted Shares (M) | 696 | 680 | 683 | 933 | 934 | 935 |
| Earnings Per Share | $3.5 | $3.59 | $4.18 | $3.77 | $4.21 | $3.98 |
| EPS Growth | n/a | 2.57% | 16.43% | -9.81% | 11.67% | -5.46% |
| Avg. Price | $43.15 | $53.41 | $72.24 | $72.98 | $79.06 | $74.84 |
| P/E Ratio | 2.48 | 2.99 | 3.38 | 19.31 | 18.73 | 18.76 |
| Free Cash Flow (M) | $1,343 | $1,131 | $2,156 | $2,585 | $1,669 | $2,444 |
| CAPEX (M) | $1,647 | $1,671 | $1,532 | $1,557 | $2,468 | $2,825 |
| EV / EBITDA | 3.67 | 3.85 | 7.0 | 20.45 | 15.59 | 12.55 |
| Total Debt (M) | $8,158 | $8,585 | $18,577 | $18,141 | $19,351 | $19,804 |
| Net Debt / EBITDA | 2.1 | 2.06 | 4.61 | 4.23 | 3.18 | 2.69 |
| Current Ratio | 0.53 | 0.5 | 0.43 | 0.59 | 0.53 | 0.6 |
Canadian Pacific Railway has rapidly growing revenues and increasing reinvestment in the business and generally positive cash flows. Additionally, the company's financial statements display strong operating margins with a stable trend and positive EPS growth. However, the firm has not enough current assets to cover current liabilities because its current ratio is 0.6. Finally, we note that Canadian Pacific Railway has significant leverage levels.
The Market May Be Undervaluing Canadian Pacific Railway's Assets and Equity:
Canadian Pacific Railway has a trailing twelve month P/E ratio of 24.1, compared to an average of 24.03 for the Industrials sector. Based on its EPS guidance of $3.6, the company has a forward P/E ratio of 21.7. The 0.4% compound average growth rate of Canadian Pacific Railway's historical and projected earnings per share yields a PEG ratio of 59.66. This suggests that these shares are overvalued. In contrast, the market is likely undervaluing Canadian Pacific Railway in terms of its equity because its P/B ratio is 1.49 while the sector average is 2.89. The company's shares are currently trading 10.8% below their Graham number.
Analysts Give Canadian Pacific Railway an Average Rating of Buy:
The 12 analysts following Canadian Pacific Railway have set target prices ranging from $72.42008 to $96.58198 per share, for an average of $89.39 with a buy rating. The company is trading -16.0% away from its average target price, indicating that there is an analyst consensus of some upside potential.
Canadian Pacific Railway has a very low short interest because 1.4% of the company's shares are sold short. Institutions own 75.9% of the company's shares, and the insider ownership rate stands at 0.12%, suggesting a small amount of insider investors. The largest shareholder is Royal Bank of Canada, whose 6% stake in the company is worth $4,094,454,453.