Now trading at a price of $71.32, Kroger has moved 0.8% so far today.
Kroger returned gains of 34.2% last year, with its stock price reaching a high of $74.9 and a low of $50.69. Over the same period, the stock outperformed the S&P 500 index by 20.1%. More recently, the company's 50-day average price was $70.54. The Kroger Co. operates as a food and drug retailer in the United States. Based in Cincinnati, OH, the Large-Cap Consumer Staples company has 410,000 full time employees. Kroger has offered a 1.8% dividend yield over the last 12 months.
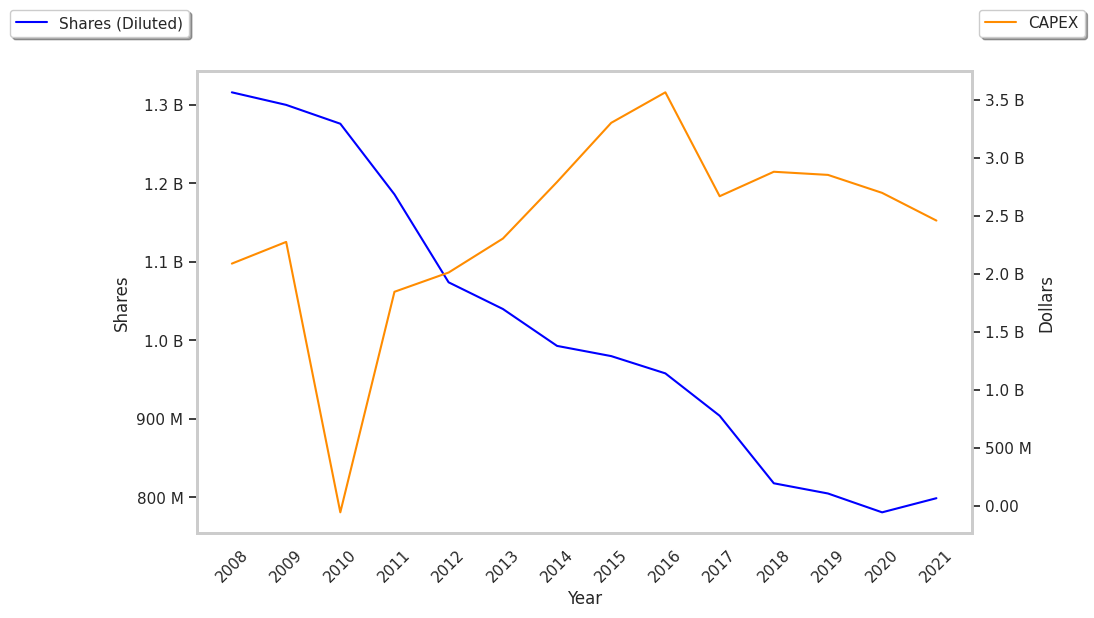
Positive Cash Flows:
| 2019 | 2020 | 2021 | 2022 | 2023 | 2024 | |
|---|---|---|---|---|---|---|
| Revenue (M) | $122,286 | $132,498 | $137,888 | $148,258 | $150,039 | $147,123 |
| Gross Margins | 22% | 23% | 22% | 21% | 22% | 23% |
| Net Margins | 1% | 2% | 1% | 2% | 1% | 2% |
| Net Income (M) | $1,659 | $2,585 | $1,655 | $2,244 | $2,164 | $2,665 |
| Net Interest Expense (M) | $603 | $544 | $571 | -$535 | -$441 | -$450 |
| Depreciation & Amort. (M) | $2,649 | $2,747 | $2,824 | $2,965 | $3,125 | $3,246 |
| Diluted Shares (M) | 780 | 752 | 724 | 725 | 728 | 664 |
| Earnings Per Share | $2.13 | $3.44 | $2.29 | $3.1 | $2.97 | $4.01 |
| EPS Growth | n/a | 61.5% | -33.43% | 35.37% | -4.19% | 35.02% |
| Avg. Price | $23.3 | $30.3 | $37.5 | $50.02 | $45.71 | $70.72 |
| P/E Ratio | 10.94 | 8.81 | 16.38 | 15.98 | 15.24 | 17.55 |
| Free Cash Flow (M) | $1,536 | $3,950 | $3,576 | $1,420 | $2,884 | $1,777 |
| CAPEX (M) | $3,128 | $2,865 | $2,614 | $3,078 | $3,904 | $4,017 |
| EV / EBITDA | 5.83 | 6.09 | 6.04 | 6.51 | 6.5 | 8.2 |
| Total Debt (M) | $12,629 | $13,149 | $11,869 | $12,005 | $20,776 | $16,210 |
| Net Debt / EBITDA | 2.13 | 1.97 | 1.74 | 1.45 | 1.19 | 1.62 |
| Current Ratio | 0.83 | 0.8 | 0.76 | 0.8 | 1.54 | 0.95 |
Kroger has slight revenue growth and increasing reinvestment in the business, a strong EPS growth trend, and healthy leverage levels. However, Kroger has slimmer gross margins than its peers, positive cash flows, and not enough current assets to cover current liabilities because its current ratio is 0.95.
a Very Low P/E Ratio but Priced Beyond Its Margin of Safety:
Kroger has a trailing twelve month P/E ratio of 19.2, compared to an average of 25.91 for the Consumer Staples sector. Based on its EPS guidance of $4.58, the company has a forward P/E ratio of 15.4. The 11.6% compound average growth rate of Kroger's historical and projected earnings per share yields a PEG ratio of 1.66. This suggests that these shares are overvalued. Furthermore, Kroger is likely overvalued compared to the book value of its equity, since its P/B ratio of 5.78 is higher than the sector average of 3.03. The company's shares are currently trading 104.9% below their Graham number.
Kroger Has an Average Rating of Buy:
The 22 analysts following Kroger have set target prices ranging from $63.0 to $85.0 per share, for an average of $76.05 with a buy rating. The company is trading -6.2% away from its average target price, indicating that there is an analyst consensus of some upside potential.
Kroger has an average amount of shares sold short because 5.2% of the company's shares are sold short. Institutions own 78.8% of the company's shares, and the insider ownership rate stands at 8.41%, suggesting a large amount of insider shareholders. The largest shareholder is Vanguard Group Inc, whose 12% stake in the company is worth $5,466,554,949.