It's been a great afternoon session for Exxon Mobil investors, who saw their shares rise 1.5% to a price of $109.04 per share. At these higher prices, is the company still fairly valued? If you are thinking about investing, make sure to check the company's fundamentals before making a decision.
Exxon Mobil Is Reasonably Priced:
Exxon Mobil Corporation engages in the exploration and production of crude oil and natural gas in the United States, Canada, the United Kingdom, Singapore, France, and internationally. The company belongs to the Energy sector, which has an average price to earnings (P/E) ratio of 18.35 and an average price to book (P/B) ratio of 1.6. In contrast, Exxon Mobil has a trailing 12 month P/E ratio of 15.5 and a P/B ratio of 1.77.
Exxon Mobil has moved -5.6% over the last year compared to 14.1% for the S&P 500 — a difference of -19.7%. Exxon Mobil has a 52 week high of $126.34 and a 52 week low of $97.8.
Growing Revenues but an Average Current Ratio:
| 2019 | 2020 | 2021 | 2022 | 2023 | 2024 | |
|---|---|---|---|---|---|---|
| Revenue (M) | $264,938 | $181,502 | $285,640 | $413,680 | $344,582 | $349,585 |
| Operating Margins | 8% | -16% | 11% | 19% | 15% | 14% |
| Net Margins | 5% | -12% | 8% | 13% | 10% | 10% |
| Net Income (M) | $14,340 | -$22,440 | $23,040 | $55,740 | $36,010 | $33,680 |
| Net Interest Expense (M) | $830 | $1,158 | $947 | $798 | $849 | $996 |
| Depreciation & Amort. (M) | $18,998 | $46,009 | $20,607 | $24,040 | $20,641 | $23,442 |
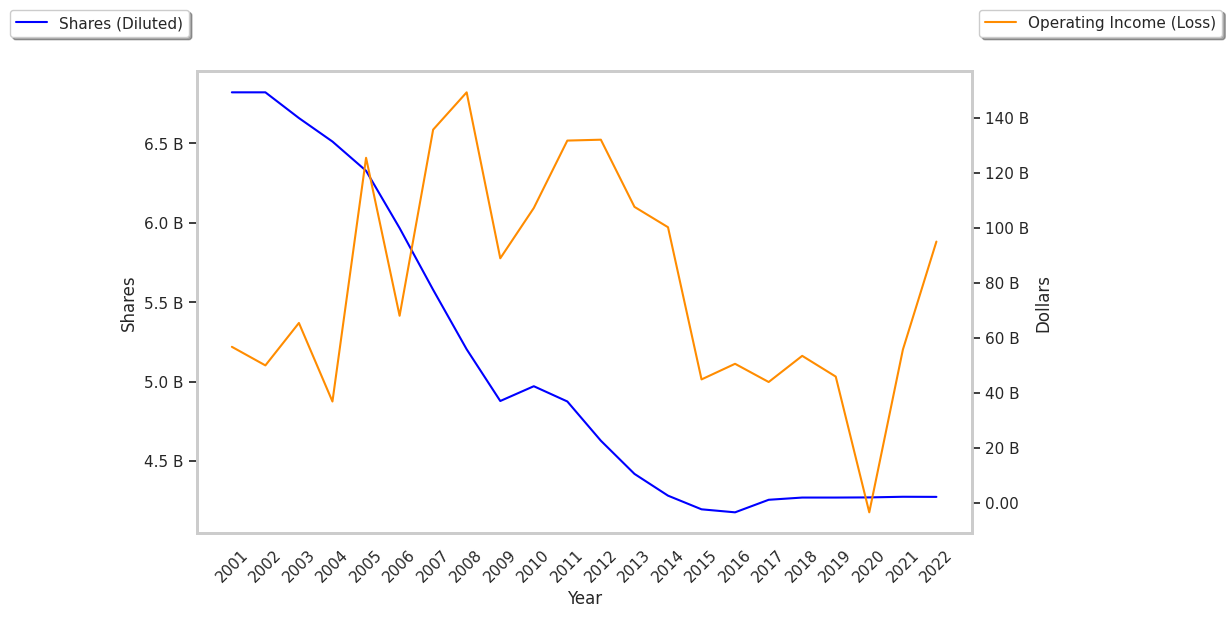
| Diluted Shares (M) | 4,235 | 4,232 | 4,233 | 4,234 | 4,071 | 3,968 |
| Earnings Per Share | $3.36 | -$5.25 | $5.39 | $13.26 | $8.89 | $7.84 |
| EPS Growth | n/a | -256.25% | 202.67% | 146.01% | -32.96% | -11.81% |
| Avg. Price | $59.44 | $38.01 | $53.43 | $80.54 | $99.98 | $109.12 |
| P/E Ratio | 17.69 | -7.24 | 9.91 | 6.07 | 11.25 | 13.92 |
| Free Cash Flow (M) | $5,355 | -$2,614 | $36,053 | $58,390 | $33,450 | $30,716 |
| CAPEX (M) | $24,361 | $17,282 | $12,076 | $18,407 | $21,919 | $24,306 |
| EV / EBITDA | 7.57 | 13.09 | 5.15 | 3.46 | 5.68 | 6.25 |
| Total Debt (M) | $46,920 | $67,640 | $47,704 | $41,193 | $41,573 | $41,710 |
| Net Debt / EBITDA | 1.12 | 3.69 | 0.79 | 0.11 | 0.14 | 0.26 |
| Current Ratio | 0.78 | 0.8 | 1.04 | 1.41 | 1.48 | 1.31 |
Exxon Mobil benefits from growing revenues and increasing reinvestment in the business, generally positive cash flows, and decent operating margins with a positive growth rate. The company's financial statements show a strong EPS growth trend and healthy leverage levels. Furthermore, Exxon Mobil has just enough current assets to cover current liabilities, as shown by its current ratio of 1.31.