Edwards Lifesciences logged a 0.5% change during today's morning session, and is now trading at a price of $81.78 per share.
Edwards Lifesciences returned gains of 14.2% last year, with its stock price reaching a high of $83.0 and a low of $64.01. Over the same period, the stock returned a similar cumulative performance to the S&P 500. The company's 50-day average price was $77.37.
Edwards Lifesciences Corporation provides products and technologies to treat advanced cardiovascular diseases in the United States, Europe, Japan, and internationally. Based in Irvine, CA, the Large-Cap Health Care company has 15,800 full time employees. Edwards Lifesciences has not offered a dividend during the last year.
Wider Gross Margins Than the Industry Average of 42.49%:
| 2019 | 2020 | 2021 | 2022 | 2023 | 2024 | |
|---|---|---|---|---|---|---|
| Revenue (M) | $4,348 | $4,386 | $5,232 | $4,464 | $5,010 | $5,440 |
| Gross Margins | 74% | 75% | 76% | 84% | 80% | 79% |
| Net Margins | 24% | 19% | 28% | 34% | 28% | 77% |
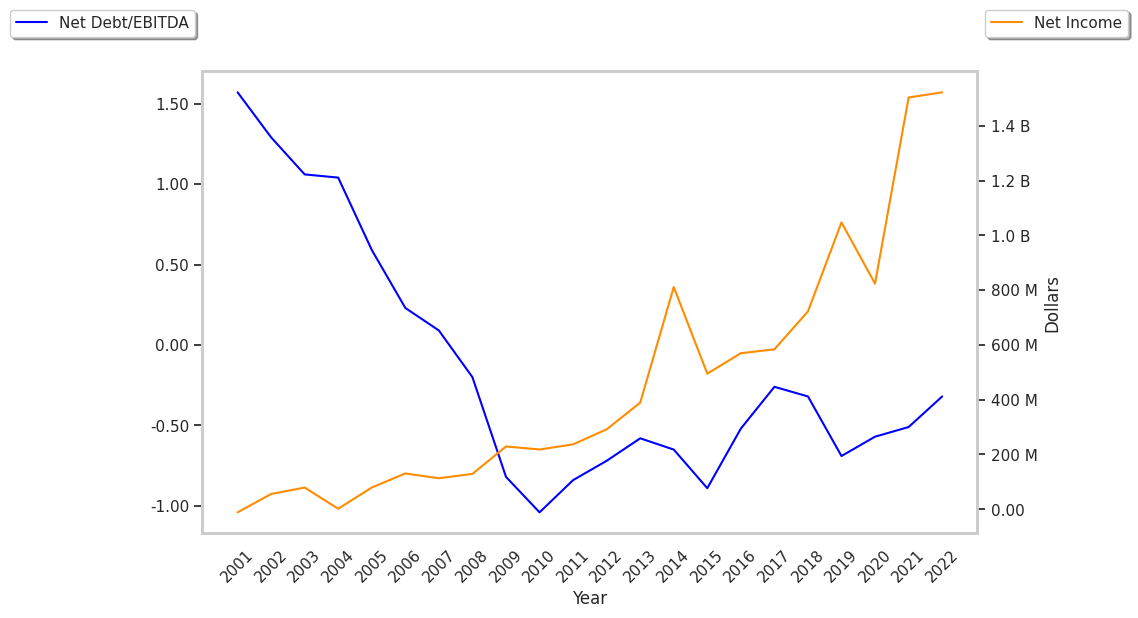
| Net Income (M) | $1,047 | $823 | $1,503 | $1,522 | $1,402 | $4,175 |
| Net Interest Expense (M) | $21 | $16 | $18 | $19 | $18 | -$20 |
| Depreciation & Amort. (M) | $89 | $107 | $135 | $140 | $145 | $138 |
| Diluted Shares (M) | 637 | 632 | 631 | 624 | 609 | 599 |
| Earnings Per Share | $1.64 | $1.3 | $2.38 | $2.44 | $2.3 | $6.97 |
| EPS Growth | n/a | -20.73% | 83.08% | 2.52% | -5.74% | 203.04% |
| Avg. Price | $66.6 | $76.09 | $102.64 | $107.47 | $76.25 | $81.39 |
| P/E Ratio | 39.64 | 58.08 | 42.59 | 44.05 | 33.01 | 11.73 |
| Free Cash Flow (M) | $928 | $647 | $1,406 | $974 | $643 | $290 |
| CAPEX (M) | $254 | $407 | $326 | $245 | $253 | $252 |
| EV / EBITDA | 33.11 | 46.92 | 34.98 | 40.78 | 31.54 | 30.66 |
| Total Debt (M) | $594 | $595 | $596 | $596 | $597 | $598 |
| Net Debt / EBITDA | -0.47 | -0.59 | -0.15 | -0.11 | -0.37 | -1.61 |
| Current Ratio | 3.31 | 3.46 | 3.08 | 3.03 | 3.38 | 4.18 |
Edwards Lifesciences has exceptional EPS growth and an excellent current ratio of 4.18. Additionally, the company's financial statements display wider gross margins than its peer group and healthy leverage levels. However, the firm has positive cash flows. Finally, we note that Edwards Lifesciences has growing revenues and decreasing reinvestment in the business.
Edwards Lifesciences's Valuation Is in Line With Its Sector Averages:
Edwards Lifesciences has a trailing twelve month P/E ratio of 32.4, compared to an average of 22.94 for the Health Care sector. Based on its EPS guidance of $2.45, the company has a forward P/E ratio of 31.6. The 5.9% compound average growth rate of Edwards Lifesciences's historical and projected earnings per share yields a PEG ratio of 5.48. This suggests that these shares are overvalued. Furthermore, Edwards Lifesciences is likely overvalued compared to the book value of its equity, since its P/B ratio of 4.56 is higher than the sector average of 3.19. The company's shares are currently trading 59.9% below their Graham number. In conclusion, Edwards Lifesciences's impressive cash flow trend, decent P/B ratio, and reasonable use of leverage demonstrate that the company may still be fairly valued -- despite its elevated earnings multiple.
Edwards Lifesciences Has an Average Rating of Buy:
The 30 analysts following Edwards Lifesciences have set target prices ranging from $72.0 to $101.0 per share, for an average of $87.55 with a buy rating. The company is trading -6.6% away from its average target price, indicating that there is an analyst consensus of some upside potential.
Edwards Lifesciences has a very low short interest because 1.6% of the company's shares are sold short. Institutions own 88.5% of the company's shares, and the insider ownership rate stands at 0.91%, suggesting a small amount of insider investors. The largest shareholder is Vanguard Group Inc, whose 12% stake in the company is worth $5,724,056,218.