Today we're going to take a closer look at Large-Cap Consumer Discretionary company Pulte, whose shares are currently trading at $125.49. We've been asking ourselves whether the company is under or over valued at today's prices... let's perform a brief value analysis to find out!
Pulte Has Attractive Multiples and Trades Below Its Graham Number:
PulteGroup, Inc., through its subsidiaries, engages in the homebuilding business in the United States. The company belongs to the Consumer Discretionary sector, which has an average price to earnings (P/E) ratio of 20.93 and an average price to book (P/B) ratio of 2.93. In contrast, Pulte has a trailing 12 month P/E ratio of 9.4 and a P/B ratio of 1.97.
Pulte has moved -2.1% over the last year compared to 14.8% for the S&P 500 -- a difference of -16.9%. Pulte has a 52 week high of $149.47 and a 52 week low of $88.07.
Strong Revenue Growth and Generally Positive Cash Flows:
| 2019 | 2020 | 2021 | 2022 | 2023 | 2024 | |
|---|---|---|---|---|---|---|
| Revenue (M) | $10,213 | $11,036 | $13,737 | $16,003 | $16,062 | $17,947 |
| Net Margins | 10% | 13% | 14% | 16% | 16% | 17% |
| Net Income (M) | $1,017 | $1,407 | $1,946 | $2,617 | $2,602 | $3,083 |
| Net Interest Expense (M) | -$9 | -$18 | -$2 | -$64 | $38 | $0 |
| Depreciation & Amort. (M) | $54 | $66 | $70 | $71 | $81 | $79 |
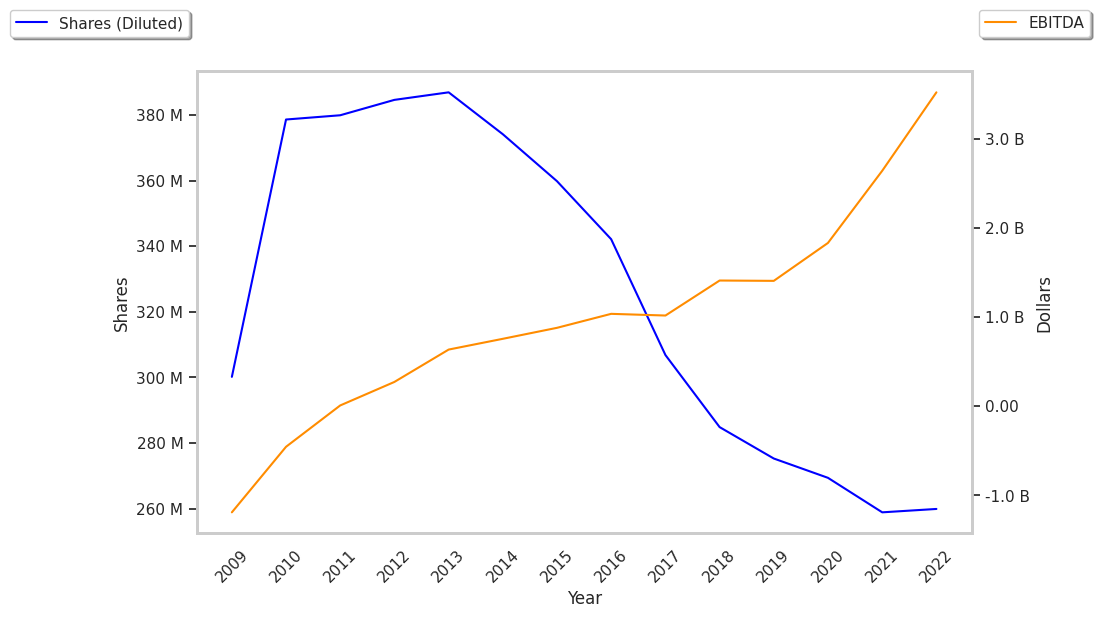
| Diluted Shares (M) | 271 | 268 | 260 | 236 | 221 | 210 |
| Earnings Per Share | $3.66 | $5.18 | $7.43 | $11.01 | $11.72 | $14.69 |
| EPS Growth | n/a | 41.53% | 43.44% | 48.18% | 6.45% | 25.34% |
| Avg. Price | $31.1 | $37.54 | $50.2 | $45.02 | $103.22 | $126.54 |
| P/E Ratio | 8.47 | 7.23 | 6.75 | 4.07 | 8.75 | 8.54 |
| Free Cash Flow (M) | $1,018 | $1,726 | $931 | $556 | $2,105 | $1,562 |
| CAPEX (M) | $58 | $58 | $73 | $113 | $92 | $119 |
| Total Debt (M) | $327 | $412 | $64 | $77 | $74 | $31 |
Pulte has rapidly growing revenues and increasing reinvestment in the business, exceptional EPS growth, and generally positive cash flows.