Now trading at a price of $275.08, Travelers has moved 0.3% so far today.
Travelers returned gains of 25.9% last year, with its stock price reaching a high of $277.83 and a low of $216.18. Over the same period, the stock outperformed the S&P 500 index by 11.1%. More recently, the company's 50-day average price was $262.66. The Travelers Companies, Inc., through its subsidiaries, provides a range of commercial and personal property, and casualty insurance products and services to businesses, government units, associations, and individuals in the United States and internationally. Based in New York, NY, the Large-Cap Finance company has 34,000 full time employees. Travelers has offered a 1.5% dividend yield over the last 12 months.
Generally Positive Cash Flows and Good EPS Growth:
| 2019 | 2020 | 2021 | 2022 | 2023 | 2024 | |
|---|---|---|---|---|---|---|
| Revenue (M) | $8,063 | $31,981 | $34,816 | $36,884 | $41,364 | $46,423 |
| Interest Income (M) | $344 | $339 | $340 | $351 | $376 | $392 |
| Operating Margins | 39% | 10% | 13% | 9% | 8% | 13% |
| Net Margins | 11% | 8% | 11% | 8% | 7% | 11% |
| Net Income (M) | $873 | $2,697 | $3,662 | $2,842 | $2,991 | $4,999 |
| Depreciation & Amort. (M) | $763 | $789 | $870 | $826 | $722 | $715 |
| Diluted Shares (M) | 262 | 255 | 251 | 240 | 232 | 231 |
| Earnings Per Share | $9.92 | $10.52 | $14.49 | $11.77 | $12.79 | $21.47 |
| EPS Growth | n/a | 6.05% | 37.74% | -18.77% | 8.67% | 67.87% |
| Avg. Price | $126.76 | $110.26 | $146.69 | $167.74 | $190.49 | $274.39 |
| P/E Ratio | 12.66 | 10.44 | 10.03 | 14.08 | 14.73 | 12.61 |
| Free Cash Flow (M) | $5,205 | $6,519 | $7,274 | $6,465 | $7,711 | $9,074 |
| EV / EBITDA | 10.27 | 8.46 | 8.19 | 11.27 | 12.63 | 10.2 |
| Total Debt (M) | $7,158 | $6,650 | $7,390 | $7,392 | $8,131 | $8,133 |
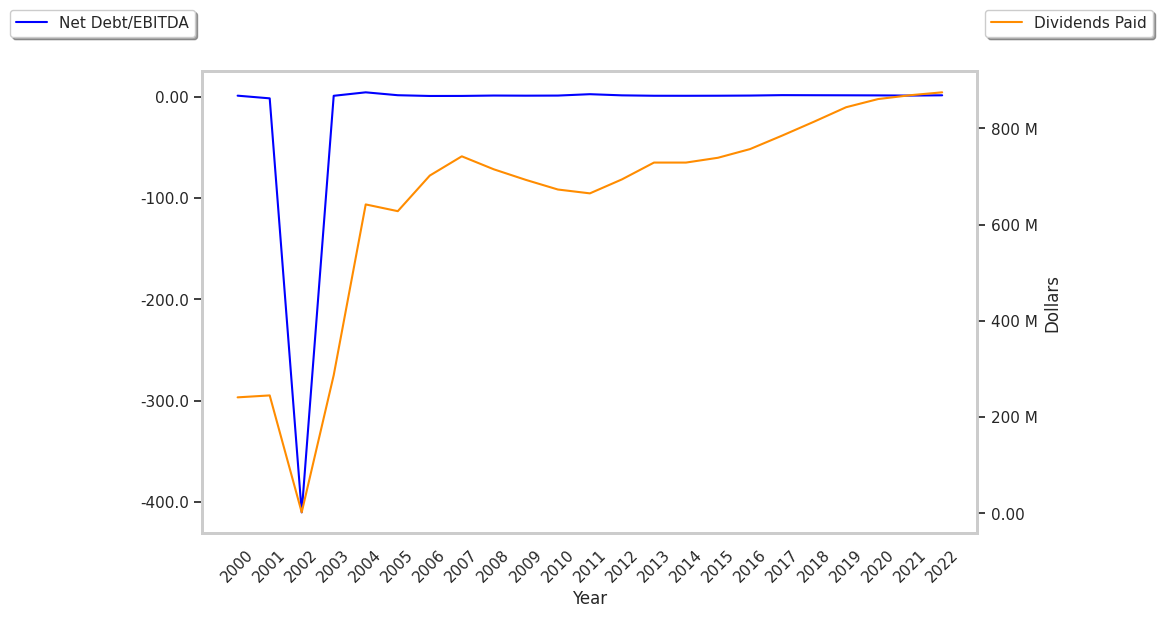
| Net Debt / EBITDA | 1.71 | 1.47 | 1.24 | 1.58 | 1.83 | 1.08 |
| Current Ratio | 0.82 | 7.21 | 7.61 | 7.99 | 6.5 | 6.99 |
Travelers has generally positive cash flows and an excellent current ratio of 6.99. Additionally, the company's financial statements display low leverage levels and a strong EPS growth trend. However, the firm has weak operating margins with a negative growth trend.
Travelers Is Currently Undervalued:
Travelers has a trailing twelve month P/E ratio of 11.6, compared to an average of 15.92 for the Finance sector. Based on its EPS guidance of $21.25, the company has a forward P/E ratio of 12.4. The 11.5% compound average growth rate of Travelers's historical and projected earnings per share yields a PEG ratio of 1.01. This implies that the shares are fairly valued. In contrast, Travelers is likely overvalued compared to the book value of its equity, since its P/B ratio of 2.1 is higher than the sector average of 1.78. The company's shares are currently trading 14.0% below their Graham number.
There's an Analyst Consensus of Some Upside Potential for Travelers:
The 20 analysts following Travelers have set target prices ranging from $233.0 to $320.0 per share, for an average of $290.7 with a buy rating. The company is trading -5.4% away from its average target price, indicating that there is an analyst consensus of some upside potential.
Travelers has a very low short interest because 1.6% of the company's shares are sold short. Institutions own 86.5% of the company's shares, and the insider ownership rate stands at 0.23%, suggesting a small amount of insider investors. The largest shareholder is Vanguard Group Inc, whose 10% stake in the company is worth $6,064,689,839.