It's been a great afternoon session for Stellantis investors, who saw their shares rise 5.1% to a price of $10.13 per share. At these higher prices, is the company still fairly valued? If you are thinking about investing, make sure to check the company's fundamentals before making a decision.
Stellantis Is Fairly Priced at Current Levels:
Stellantis N.V. engages in the design, engineering, manufacturing, distribution, and sale of automobiles and light commercial vehicles, engines, transmission systems, metallurgical products, mobility services, and production systems worldwide. The company belongs to the Industrials sector, which has an average price to earnings (P/E) ratio of 24.03 and an average price to book (P/B) ratio of 2.89. In contrast, Stellantis has a trailing 12 month P/E ratio of -10.9 and a P/B ratio of 0.4.
Stellantis has moved -39.2% over the last year compared to 15.1% for the S&P 500 -- a difference of -54.3%. Stellantis has a 52 week high of $16.92 and a 52 week low of $8.39.
A Flat EPS Growth Trend and Positive Cash Flows:
| 2019 | 2020 | 2021 | 2022 | 2023 | 2024 | |
|---|---|---|---|---|---|---|
| Revenue (M) | $58,993 | $47,656 | $149,419 | $179,592 | $189,544 | $156,878 |
| Operating Margins | 6% | 6% | 11% | 11% | 12% | 2% |
| Net Margins | 6% | 4% | 10% | 9% | 10% | 4% |
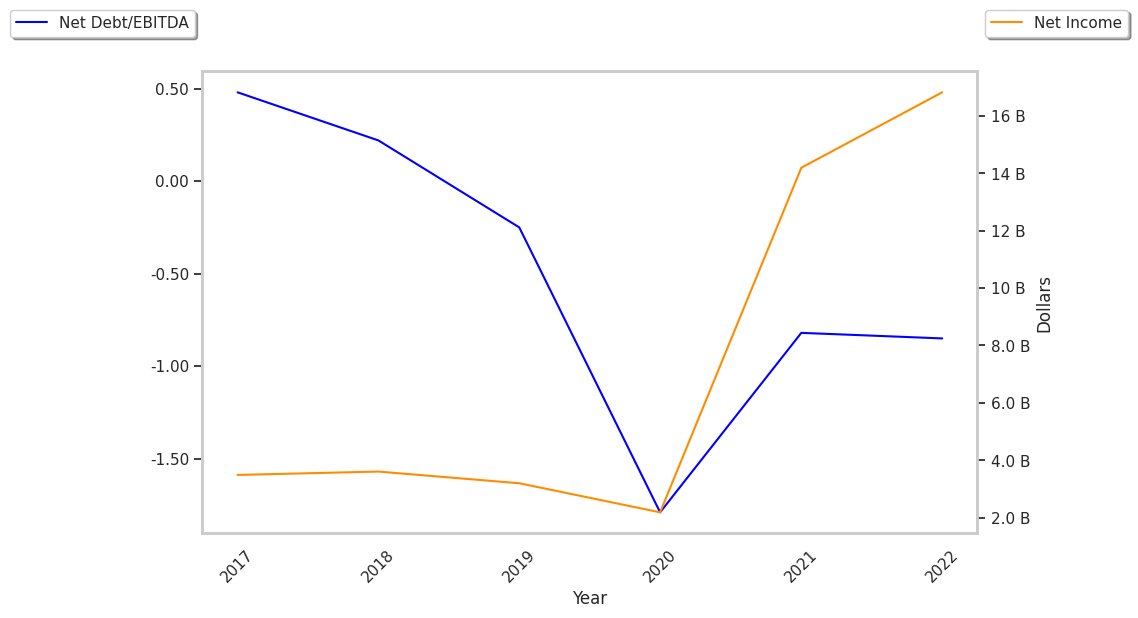
| Net Income (M) | $3,584 | $2,023 | $14,208 | $16,779 | $18,625 | $5,520 |
| Net Interest Expense (M) | $140 | $178 | $545 | $959 | $1,064 | $1,248 |
| Diluted Shares (M) | 1,568 | 1,575 | 3,133 | 3,133 | 3,023 | 2,880 |
| Earnings Per Share | $1.95 | $1.34 | $4.51 | $5.31 | $5.94 | $1.84 |
| EPS Growth | n/a | -31.28% | 236.57% | 17.74% | 11.86% | -69.02% |
| Avg. Price | $9.06 | $8.22 | $15.76 | $14.07 | $23.32 | $10.13 |
| P/E Ratio | 4.42 | 5.83 | 3.4 | 2.63 | 3.9 | 5.45 |
| Free Cash Flow (M) | $8,667 | $12,273 | $18,646 | $19,959 | $22,485 | $4,008 |
| Total Debt (M) | $8,025 | $11,068 | $22,624 | $19,469 | $20,001 | $25,028 |
| Current Ratio | 0.81 | 1.19 | 1.15 | 1.27 | 1.24 | 1.09 |