Today we're going to take a closer look at Large-Cap Finance company Citizens Financial, whose shares are currently trading at $50.68. We've been asking ourselves whether the company is under or over valued at today's prices... let's perform a brief value analysis to find out!
Citizens Financial Is Potentially Undervalued and Potentially Undervalued:
Citizens Financial Group, Inc. operates as the bank holding company that provides retail and commercial banking products and services to individuals, small businesses, middle-market companies, large corporations, and institutions in the United States. The company belongs to the Finance sector, which has an average price to earnings (P/E) ratio of 15.92 and an average price to book (P/B) ratio of 1.78. In contrast, Citizens Financial has a trailing 12 month P/E ratio of 15.5 and a P/B ratio of 0.95.
Citizens Financial has moved 18.9% over the last year compared to 15.1% for the S&P 500 -- a difference of 3.7%. Citizens Financial has a 52 week high of $50.88 and a 52 week low of $32.6.
Low Leverage Levels but a Declining EPS Growth Trend:
| 2019 | 2020 | 2021 | 2022 | 2023 | 2024 | |
|---|---|---|---|---|---|---|
| Revenue (M) | $6,189 | $5,357 | $4,851 | $7,060 | $10,204 | $7,809 |
| Interest Income (M) | $4,614 | $4,586 | $4,512 | $6,012 | $6,241 | $5,633 |
| Operating Margins | 36% | 24% | 61% | 38% | 20% | 24% |
| Net Margins | 28% | 20% | 48% | 28% | 16% | 19% |
| Net Income (M) | $1,791 | $1,057 | $2,319 | $2,073 | $1,608 | $1,509 |
| Depreciation & Amort. (M) | $633 | $578 | $625 | $565 | $478 | $132 |
| Diluted Shares (M) | 451 | 428 | 427 | 478 | 477 | 454 |
| Earnings Per Share | $3.81 | $2.22 | $5.16 | $4.1 | $3.13 | $3.03 |
| EPS Growth | n/a | -41.73% | 132.43% | -20.54% | -23.66% | -3.19% |
| Avg. Price | $29.78 | $24.67 | $41.82 | $42.68 | $33.14 | $50.77 |
| P/E Ratio | 7.8 | 11.11 | 8.07 | 10.36 | 10.55 | 16.65 |
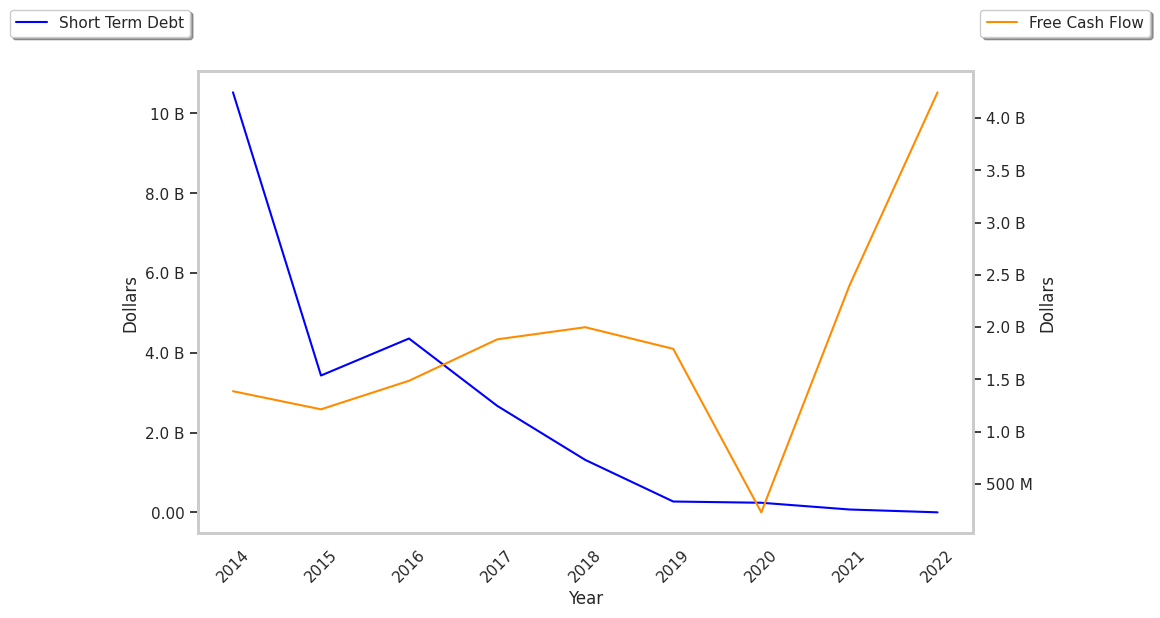
| Free Cash Flow (M) | $1,571 | -$7 | $2,151 | $3,993 | $2,789 | $1,879 |
| CAPEX (M) | $126 | $118 | $124 | $126 | $172 | $122 |
| EV / EBITDA | 8.45 | 3.28 | 4.32 | 7.25 | 7.13 | 12.42 |
| Total Debt (M) | $14,047 | $8,346 | $6,932 | $15,887 | $13,467 | $12,401 |
| Net Debt / EBITDA | 3.7 | -2.34 | -0.62 | 1.66 | 0.73 | 0.89 |
Citizens Financial has low leverage levels, growing revenues and a flat capital expenditure trend, and generally positive cash flows. However, the firm has declining EPS growth. Finally, we note that Citizens Financial has decent net margins with a negative growth trend.