Today we're going to take a closer look at Large-Cap Consumer Discretionary company D.R. Horton, whose shares are currently trading at $168.96. We've been asking ourselves whether the company is under or over valued at today's prices... let's perform a brief value analysis to find out!
D.R. Horton Has Attractive Multiples and Trading Near Its Fair Price:
D.R. Horton, Inc. operates as a homebuilding company in East, North, Southeast, South Central, Southwest, and Northwest regions in the United States. The company belongs to the Consumer Discretionary sector, which has an average price to earnings (P/E) ratio of 20.93 and an average price to book (P/B) ratio of 2.93. In contrast, D.R. Horton has a trailing 12 month P/E ratio of 13.6 and a P/B ratio of 2.1.
D.R. Horton has moved -9.7% over the last year compared to 15.1% for the S&P 500 -- a difference of -24.9%. D.R. Horton has a 52 week high of $199.85 and a 52 week low of $110.44.
Strong Revenue Growth and Healthy Leverage Levels:
| 2019 | 2020 | 2021 | 2022 | 2023 | 2024 | |
|---|---|---|---|---|---|---|
| Revenue (M) | $17,593 | $20,311 | $27,774 | $33,480 | $35,460 | $36,801 |
| Operating Margins | 12% | 15% | 19% | 23% | 18% | 17% |
| Net Margins | 9% | 12% | 15% | 17% | 13% | 13% |
| Net Income (M) | $1,618 | $2,374 | $4,176 | $5,858 | $4,746 | $4,756 |
| Net Interest Expense (M) | $32 | $33 | $42 | $59 | $213 | $204 |
| Depreciation & Amort. (M) | $72 | $91 | $82 | $81 | $92 | $78 |
| Diluted Shares (M) | 373 | 370 | 360 | 347 | 336 | 323 |
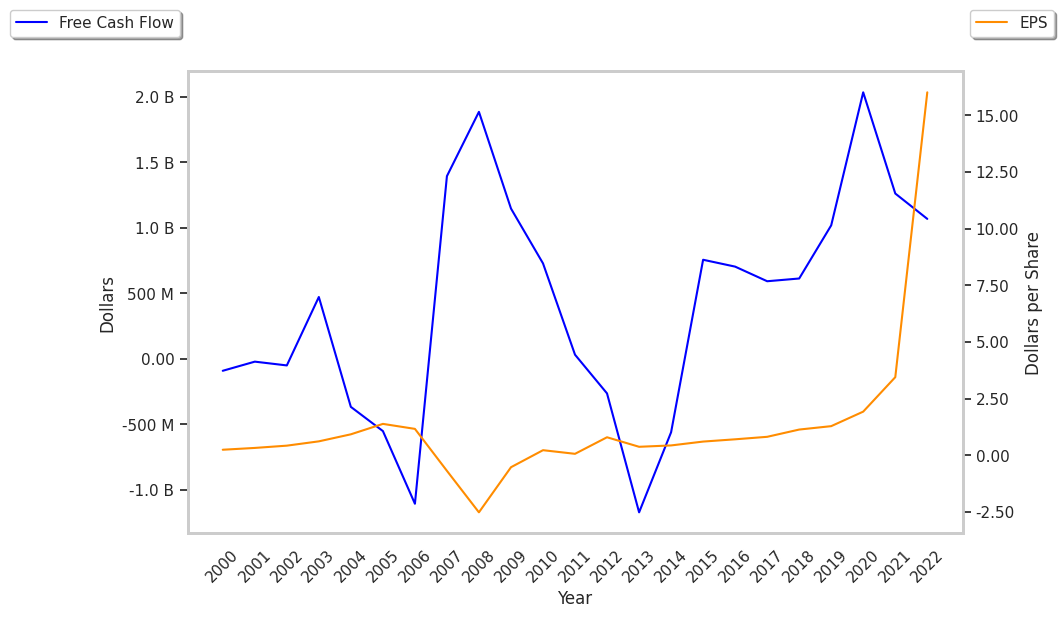
| Earnings Per Share | $4.29 | $6.41 | $11.41 | $16.51 | $13.82 | $14.34 |
| EPS Growth | n/a | 49.42% | 78.0% | 44.7% | -16.29% | 3.76% |
| Avg. Price | $44.28 | $58.7 | $88.42 | $77.19 | $151.98 | $170.68 |
| P/E Ratio | 10.2 | 9.04 | 7.65 | 4.64 | 10.91 | 11.82 |
| Free Cash Flow (M) | $765 | $1,325 | $441 | $414 | $4,156 | $2,024 |
| CAPEX (M) | $127 | $96 | $94 | $148 | $149 | $165 |
| EV / EBITDA | 8.74 | 8.05 | 6.72 | 4.21 | 8.57 | 9.45 |
| Total Debt (M) | $4,471 | $5,812 | $7,440 | $8,453 | $7,614 | $8,395 |
| Net Debt / EBITDA | 1.31 | 1.09 | 0.92 | 0.76 | 0.67 | 0.84 |
D.R. Horton benefits from rapidly growing revenues and increasing reinvestment in the business, strong operating margins with a stable trend, and exceptional EPS growth. The company's financial statements show generally positive cash flows and healthy leverage levels.