Advanced Micro Devices logged a 1.5% change during today's morning session, and is now trading at a price of $165.87 per share.
Advanced Micro Devices returned gains of 8.5% last year, with its stock price reaching a high of $186.65 and a low of $76.48. Over the same period, the stock underperformed the S&P 500 index by -5.9%. The company's 50-day average price was $155.77. Advanced Micro Devices, Inc. operates as a semiconductor company worldwide. Based in Santa Clara, CA, the Large-Cap Technology company has 28,000 full time employees. Advanced Micro Devices has not offered a dividend during the last year.
Wider Gross Margins Than the Industry Average of 42.19%:
| 2019 | 2020 | 2021 | 2022 | 2023 | 2024 | |
|---|---|---|---|---|---|---|
| Revenue (M) | $6,731 | $9,763 | $16,434 | $23,601 | $22,680 | $25,785 |
| Gross Margins | 43% | 45% | 48% | 45% | 46% | 49% |
| Net Margins | 5% | 26% | 19% | 6% | 4% | 6% |
| Net Income (M) | $341 | $2,490 | $3,162 | $1,320 | $854 | $1,641 |
| Net Interest Expense (M) | $94 | $47 | $34 | -$88 | $106 | $182 |
| Depreciation & Amort. (M) | $222 | $312 | $407 | $626 | $642 | $454 |
| Diluted Shares (M) | 1,188 | 1,226 | 1,229 | 1,571 | 1,625 | 1,637 |
| Earnings Per Share | $0.3 | $2.06 | $2.57 | $1571.0 | $0.53 | $1.0 |
| EPS Growth | n/a | 586.67% | 24.76% | 61028.4% | -99.97% | 88.68% |
| Avg. Price | $29.94 | $65.62 | $101.15 | $105.33 | $147.41 | $163.36 |
| P/E Ratio | 96.58 | 31.25 | 38.75 | 0.07 | 278.13 | 161.74 |
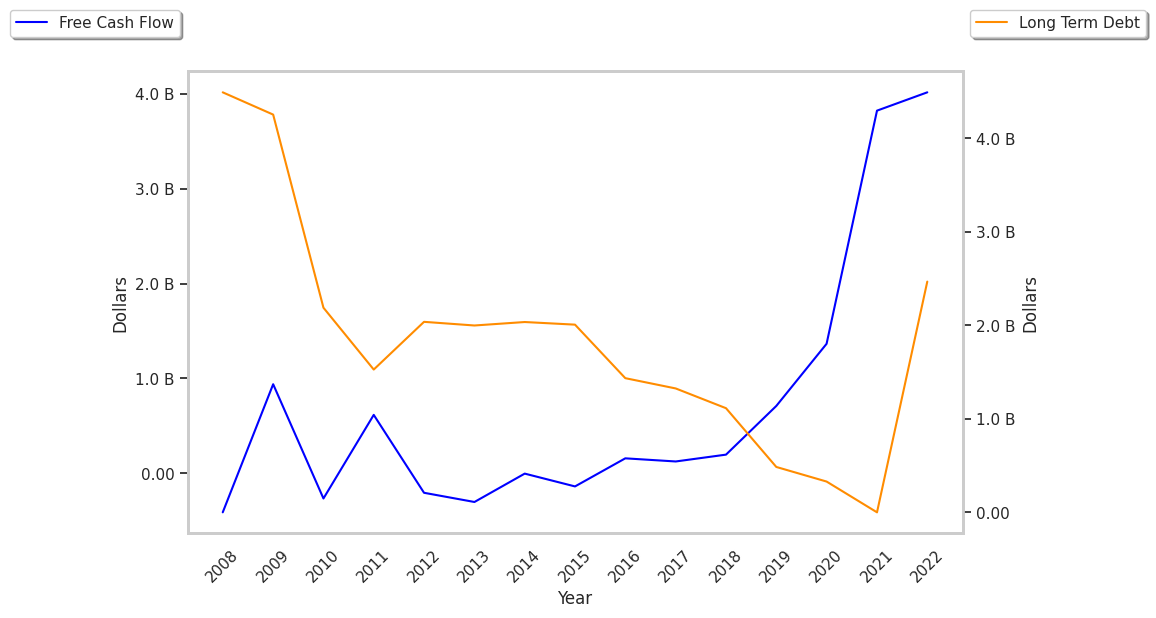
| Free Cash Flow (M) | $276 | $777 | $3,220 | $3,115 | $1,121 | $2,405 |
| CAPEX (M) | $217 | $294 | $301 | $450 | $546 | $636 |
| EV / EBITDA | 34.14 | 44.91 | 29.59 | 69.31 | 227.26 | 111.98 |
| Total Debt (M) | $486 | $330 | $2 | $4,934 | $3,434 | $3,442 |
| Net Debt / EBITDA | -1.15 | -0.75 | -0.62 | 0.05 | -0.48 | -0.15 |
| Current Ratio | 1.95 | 2.54 | 2.02 | 2.36 | 2.51 | 2.62 |
Advanced Micro Devices has rapidly growing revenues and increasing reinvestment in the business, exceptional EPS growth, and generally positive cash flows. The company also benefits from an excellent current ratio of 2.62, wider gross margins than its peer group, and healthy leverage levels.
Advanced Micro Devices's Valuation Is in Line With Its Sector Averages:
Advanced Micro Devices has a trailing twelve month P/E ratio of 93.3, compared to an average of 30.44 for the Technology sector. Based on its EPS guidance of $5.1, the company has a forward P/E ratio of 30.5. Advanced Micro Devices's PEG ratio is 4.4 on the basis of the 21.2% weighted average of the company and the broader market's EPS compound average growth rates. This suggests that the company's shares are overvalued. The market is placing a fair value on Advanced Micro Devices's equity, since its P/B ratio of 4.51 is comparable to its sector average of 4.19. The company's shares are currently trading 489.6% below their Graham number.
Advanced Micro Devices Has an Analyst Consensus of Some Upside Potential:
The 43 analysts following Advanced Micro Devices have set target prices ranging from $125.1 to $230.0 per share, for an average of $184.12 with a buy rating. The company is trading -9.9% away from its average target price, indicating that there is an analyst consensus of some upside potential.
Advanced Micro Devices has an average amount of shares sold short because 2.6% of the company's shares are sold short. Institutions own 69.2% of the company's shares, and the insider ownership rate stands at 0.51%, suggesting a small amount of insider investors. The largest shareholder is Vanguard Group Inc, whose 10% stake in the company is worth $25,650,833,847.