It hasn't been a great afternoon session for Dollar General investors, who have watched their shares sink by -1.5% to a price of $110.72. Some of you might be wondering if it's time to buy the dip. If you are considering this, make sure to check the company's fundamentals first to determine if the shares are fairly valued at today's prices.
Dollar General's Valuation Is in Line With Its Sector Averages:
Dollar General Corporation, a discount retailer, provides various merchandise products in the southern, southwestern, midwestern, and eastern United States. The company belongs to the Consumer Discretionary sector, which has an average price to earnings (P/E) ratio of 20.93 and an average price to book (P/B) ratio of 2.93. In contrast, Dollar General has a trailing 12 month P/E ratio of 21.1 and a P/B ratio of 3.16.
Dollar General has moved -10.2% over the last year compared to 14.5% for the S&P 500 — a difference of -24.7%. Dollar General has a 52 week high of $125.42 and a 52 week low of $66.43.
Increasing Revenues but Narrowing Margins:
| 2019 | 2020 | 2021 | 2022 | 2023 | 2024 | |
|---|---|---|---|---|---|---|
| Revenue (M) | $27,754 | $33,747 | $34,220 | $37,845 | $38,692 | $40,612 |
| Gross Margins | 31% | 32% | 32% | 31% | 30% | 30% |
| Net Margins | 6% | 8% | 7% | 6% | 4% | 3% |
| Net Income (M) | $1,713 | $2,655 | $2,399 | $2,416 | $1,661 | $1,125 |
| Net Interest Expense (M) | $101 | $150 | $158 | -$211 | -$327 | -$274 |
| Depreciation & Amort. (M) | $500 | $569 | $636 | $718 | $840 | $964 |
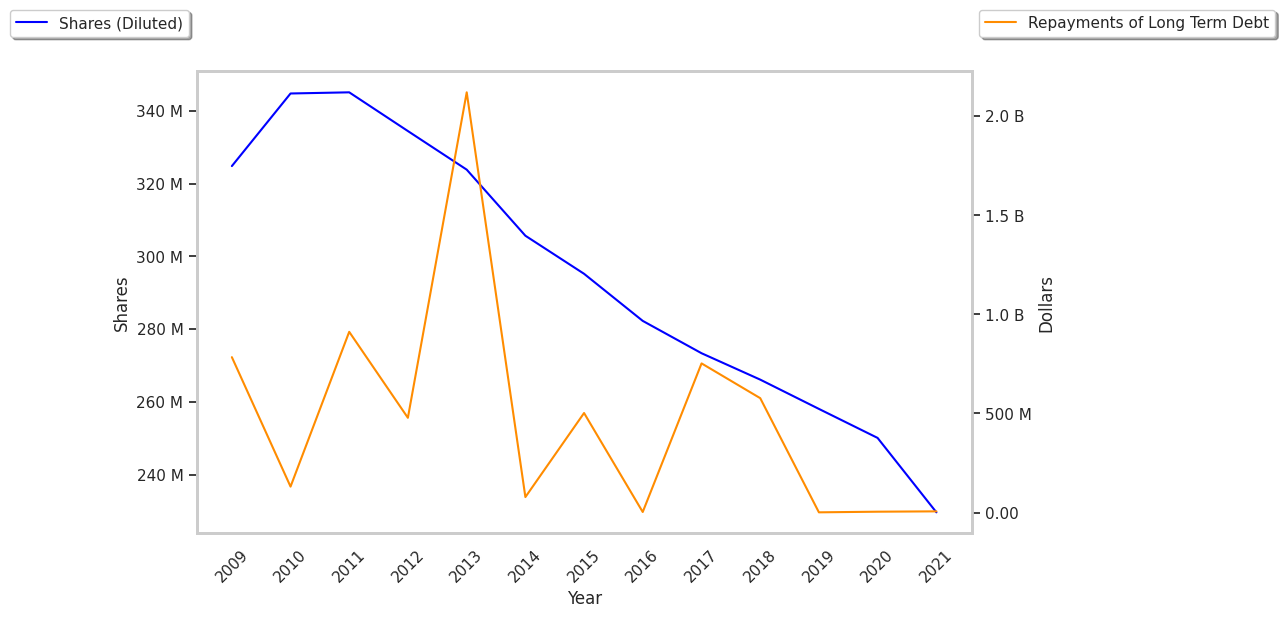
| Diluted Shares (M) | 249 | 234 | 226 | 220 | 220 | 220 |
| Earnings Per Share | $6.64 | $10.62 | $10.17 | $10.68 | $7.55 | $5.11 |
| EPS Growth | n/a | 59.94% | -4.24% | 5.01% | -29.31% | -32.32% |
| Avg. Price | $132.44 | $182.28 | $210.49 | $221.72 | $135.95 | $110.72 |
| P/E Ratio | 19.83 | 17.04 | 20.56 | 20.66 | 17.96 | 21.62 |
| Free Cash Flow (M) | $1,453 | $2,848 | $1,795 | $424 | $692 | $1,686 |
| CAPEX (M) | $785 | $1,028 | $1,070 | $1,561 | $1,700 | $1,310 |
| EV / EBITDA | 12.59 | 11.46 | 13.74 | 13.51 | 10.67 | 10.91 |
| Total Debt (M) | $4,132 | $4,127 | $5,191 | $6,441 | $5,723 | $5,725 |
| Net Debt / EBITDA | 0.69 | 0.88 | 1.25 | 1.5 | 1.58 | 1.82 |
| Current Ratio | 1.28 | 1.08 | 1.23 | 1.22 | 1.15 | 1.23 |