We've been asking ourselves recently if the market has placed a fair valuation on Target. Let's dive into some of the fundamental values of this Large-Cap Consumer Discretionary company to determine if there might be an opportunity here for value-minded investors.
a Very Low P/E Ratio but Priced Beyond Its Margin of Safety:
Target Corporation operates as a general merchandise retailer in the United States. The company belongs to the Consumer Discretionary sector, which has an average price to earnings (P/E) ratio of 20.93 and an average price to book (P/B) ratio of 2.93. In contrast, Target has a trailing 12 month P/E ratio of 11.2 and a P/B ratio of 2.83.
Target has moved -38.8% over the last year compared to 14.5% for the S&P 500 -- a difference of -53.2%. Target has a 52 week high of $161.5 and a 52 week low of $87.35.
Increasing Revenues but Narrowing Margins:
| 2019 | 2020 | 2021 | 2022 | 2023 | 2024 | |
|---|---|---|---|---|---|---|
| Revenue (M) | $78,112 | $93,561 | $106,005 | $109,120 | $107,412 | $106,566 |
| Operating Margins | 6% | 7% | 8% | 4% | 5% | 5% |
| Net Margins | 4% | 5% | 7% | 3% | 4% | 4% |
| Net Income (M) | $3,281 | $4,368 | $6,946 | $2,780 | $4,138 | $4,091 |
| Net Interest Expense (M) | $477 | $977 | $421 | $478 | $502 | $615 |
| Depreciation & Amort. (M) | $2,357 | $2,230 | $2,344 | $2,385 | $2,415 | $3,000 |
| Diluted Shares (M) | 505 | 489 | 462 | 463 | 462 | 456 |
| Earnings Per Share | $6.36 | $8.64 | $14.1 | $5.98 | $8.94 | $8.86 |
| EPS Growth | n/a | 35.85% | 63.19% | -57.59% | 49.5% | -0.89% |
| Avg. Price | $84.79 | $125.33 | $216.57 | $195.92 | $142.42 | $95.98 |
| P/E Ratio | 13.21 | 14.37 | 15.22 | 32.54 | 15.9 | 10.8 |
| Free Cash Flow (M) | $4,090 | $7,876 | $5,081 | -$1,510 | $3,815 | $4,476 |
| CAPEX (M) | $3,027 | $2,649 | $3,544 | $5,528 | $4,806 | $2,891 |
| EV / EBITDA | 7.0 | 7.92 | 10.06 | 16.57 | 9.58 | 6.58 |
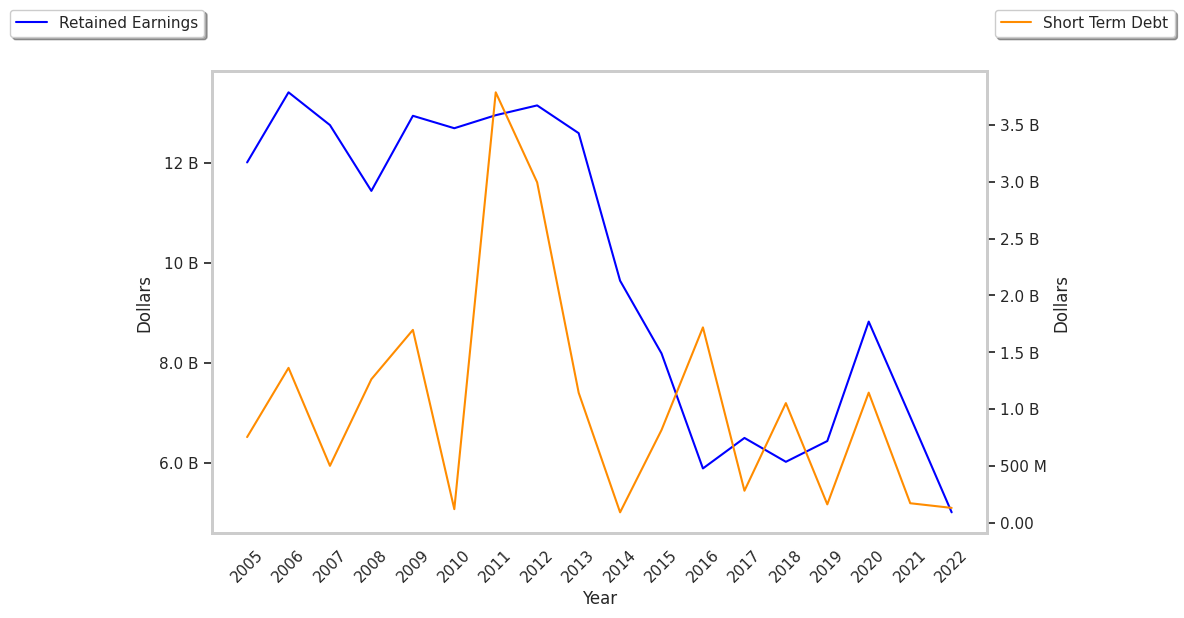
| Total Debt (M) | $12,651 | $12,730 | $14,408 | $15,013 | $15,462 | $15,540 |
| Net Debt / EBITDA | 0.95 | 0.8 | 1.19 | 2.1 | 1.48 | 1.48 |
| Current Ratio | 1.05 | 0.97 | 0.86 | 0.86 | 0.94 | 0.94 |
Target has growing revenues and a flat capital expenditure trend, positive EPS growth, and healthy leverage levels. However, Target has weak operating margins with a negative growth trend, positive cash flows, and not enough current assets to cover current liabilities because its current ratio is 0.94.