Franklin Resources may be undervalued with poor growth indicators, but the 10 analysts following the company give it an rating of hold. Their target prices range from $19.0 to $31.0 per share, for an average of $25.0. At today's price of $25.64, Franklin Resources is trading 2.54% away from its average target price, suggesting there is an analyst consensus of little upside potential for the stock.
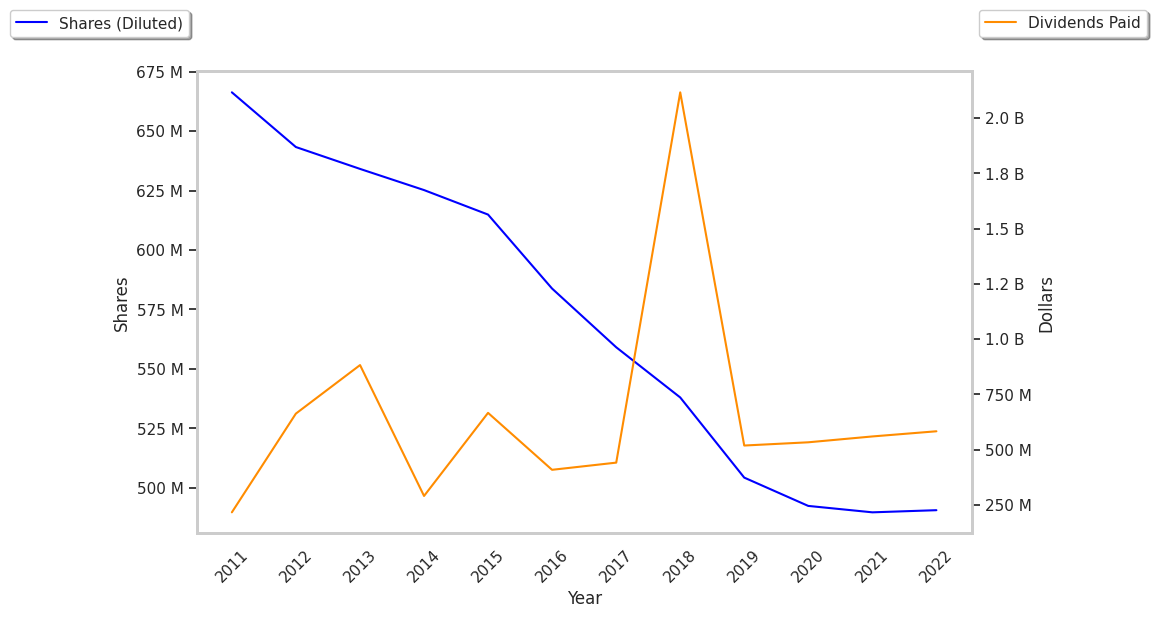
Franklin Resources, Inc. is a publicly owned asset management holding company. Based in San Mateo, CA, the Large-Cap Finance company has 10,100 full time employees. Franklin Resources has provided a 5.0% dividend yield over the last 12 months.
Franklin Resources has a trailing twelve month P/E ratio of 50.3, compared to an average of 15.92 for the Finance sector. Considering its EPS guidance of $2.6, the company has a forward P/E ratio of 9.9.
On the other hand, the market is potentially undervaluing Franklin Resources in terms of its book value because its P/B ratio is 1.09. In comparison, the sector average P/B ratio is 1.78. The company's shares are currently 16.2% below their Graham number, indicating that its shares have a margin of safety.
If analysts are giving the stock a bad rating, it's likely that they are looking beyond simple valaution metrics and attempting to forecast the company's growth potential. For example, Franklin Resources has narrow margins as you can see in the financial summary below.
| 2019 | 2020 | 2021 | 2022 | 2023 | 2024 | |
|---|---|---|---|---|---|---|
| Revenue (M) | $5,774 | $5,566 | $8,426 | $8,275 | $7,849 | $8,478 |
| Interest Income (M) | $22 | -$31 | $85 | $98 | $124 | $97 |
| Operating Margins | 25% | 19% | 28% | 21% | 17% | 5% |
| Net Margins | 21% | 14% | 22% | 16% | 11% | 5% |
| Net Income (M) | $1,196 | $799 | $1,831 | $1,292 | $883 | $465 |
| Depreciation & Amort. (M) | $83 | $74 | $79 | $96 | $104 | $130 |
| Diluted Shares (M) | 495 | 492 | 491 | 490 | 488 | 518 |
| Earnings Per Share | $2.41 | $1.62 | $3.73 | $2.64 | $1.81 | $0.9 |
| EPS Growth | n/a | -32.78% | 130.25% | -29.22% | -31.44% | -50.28% |
| Avg. Price | $25.71 | $18.57 | $28.32 | $26.18 | $29.79 | $25.64 |
| P/E Ratio | 10.71 | 11.75 | 7.76 | 10.11 | 16.74 | 28.81 |
| Free Cash Flow (M) | $35 | $980 | $1,166 | $1,866 | $940 | $794 |
| CAPEX (M) | $234 | $104 | $79 | $90 | $149 | $177 |
| EV / EBITDA | 4.86 | 7.71 | 5.18 | 6.55 | 9.64 | 23.36 |
| Total Debt (M) | $697 | $3,753 | $3,394 | $3,370 | $3,047 | $2,776 |
| Net Debt / EBITDA | -3.41 | -0.63 | -0.46 | -0.62 | -0.58 | -1.62 |