Now trading at a price of $189.29, Palo Alto Networks has moved 0.9% so far today.
Over the last year, Palo Alto Networks logged a 4.7% change, with its stock price reaching a high of $210.39 and a low of $144.15. Over the same period, the stock underperformed the S&P 500 index by -11.2%. AThe company's 50-day average price was $189.76. Palo Alto Networks, Inc. provides cybersecurity solutions worldwide. The Large-Cap Technology company is based in Santa Clara, CA. Palo Alto Networks has not offered a dividend during the last year.
Wider Gross Margins Than the Industry Average of 45.92%:
| 2019 | 2020 | 2021 | 2022 | 2023 | 2024 | |
|---|---|---|---|---|---|---|
| Revenue (M) | $2,900 | $3,408 | $4,256 | $5,502 | $6,893 | $8,028 |
| Gross Margins | 72% | 71% | 70% | 69% | 72% | 74% |
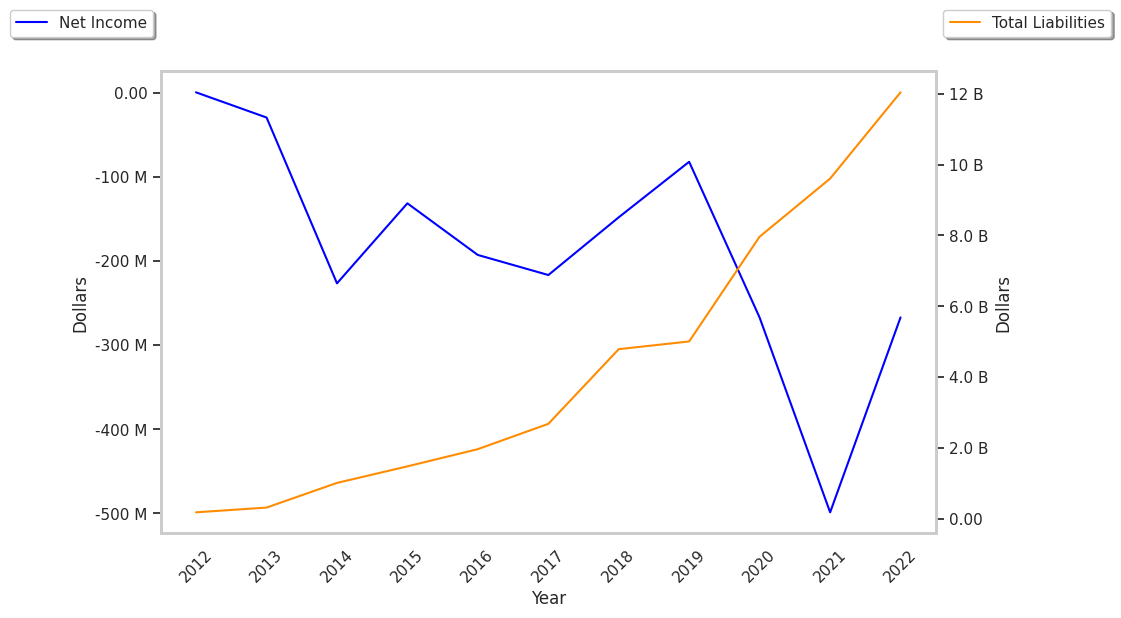
| Net Margins | -3% | -8% | -12% | -5% | 6% | 32% |
| Net Income (M) | -$82 | -$267 | -$499 | -$267 | $440 | $2,578 |
| Net Interest Expense (M) | $84 | $89 | $163 | $27 | $27 | $8 |
| Depreciation & Amort. (M) | $154 | $206 | $260 | $283 | $282 | $283 |
| Diluted Shares (M) | 567 | 581 | 586 | 677 | 700 | 709 |
| Earnings Per Share | -$0.14 | -$0.46 | -$0.85 | -$0.39 | $0.63 | $3.64 |
| EPS Growth | n/a | -228.57% | -84.78% | 54.12% | 261.54% | 477.78% |
| Avg. Price | $73.85 | $79.34 | $138.02 | $177.95 | $294.88 | $187.61 |
| P/E Ratio | -263.75 | -86.24 | -80.71 | -199.94 | 207.66 | 23.69 |
| Free Cash Flow (M) | $924 | $821 | $1,387 | $1,792 | $2,631 | $3,101 |
| CAPEX (M) | $131 | $214 | $116 | $193 | $146 | $157 |
| EV / EBITDA | 217.2 | 882.5 | -954.95 | 584.82 | 135.17 | 61.79 |
| Total Debt (M) | $1,430 | $3,119 | $3,672 | $3,679 | $1,992 | $964 |
| Net Debt / EBITDA | 1.67 | 36.06 | -32.02 | 17.18 | -0.75 | -1.36 |
| Current Ratio | 1.78 | 1.63 | 0.68 | 0.7 | 0.86 | 0.84 |
Palo Alto Networks benefits from rapidly growing revenues and a flat capital expenditure trend, exceptional EPS growth, and generally positive cash flows. The company's financial statements show low leverage levels and wider gross margins than its peer group. However, the firm has not enough current assets to cover current liabilities because its current ratio is 0.84.
Palo Alto Networks's Valuation Is in Line With Its Sector Averages:
Palo Alto Networks has a trailing twelve month P/E ratio of 119.3, compared to an average of 30.44 for the Technology sector. Based on its EPS guidance of $7.2, the company has a forward P/E ratio of 26.4. Palo Alto Networks's PEG ratio is 4.65 on the basis of the 25.7% weighted average of the company and the broader market's EPS compound average growth rates. This suggests that the company's shares are overvalued. Furthermore, Palo Alto Networks is likely overvalued compared to the book value of its equity, since its P/B ratio of 16.19 is higher than the sector average of 4.19. The company's shares are currently trading 624.4% below their Graham number. Ultimately, Palo Alto Networks's strong cash flows, decent earnings multiple, and healthy debt levels factor towards it being fairly valued, its elevated P/B ratio notwithstanding.
Analysts Give Palo Alto Networks an Average Rating of Buy:
The 46 analysts following Palo Alto Networks have set target prices ranging from $131.0 to $240.0 per share, for an average of $213.86 with a buy rating. The company is trading -11.5% away from its average target price, indicating that there is an analyst consensus of some upside potential.
Palo Alto Networks has an average amount of shares sold short because 6.9% of the company's shares are sold short. Institutions own 83.1% of the company's shares, and the insider ownership rate stands at 0.94%, suggesting a small amount of insider investors. The largest shareholder is Vanguard Group Inc, whose 66% stake in the company is worth $12,117,659,004.