PNC Financial Services logged a 0.0% change during today's morning session, and is now trading at a price of $206.13 per share.
PNC Financial Services returned gains of 12.6% last year, with its stock price reaching a high of $216.26 and a low of $145.12. Over the same period, the stock underperformed the S&P 500 index by -3.3%. The company's 50-day average price was $192.04. The PNC Financial Services Group, Inc. operates as a diversified financial services company in the United States. Based in Pittsburgh, PA, the Large-Cap Finance company has 53,175 full time employees. PNC Financial Services has offered a 3.1% dividend yield over the last 12 months.
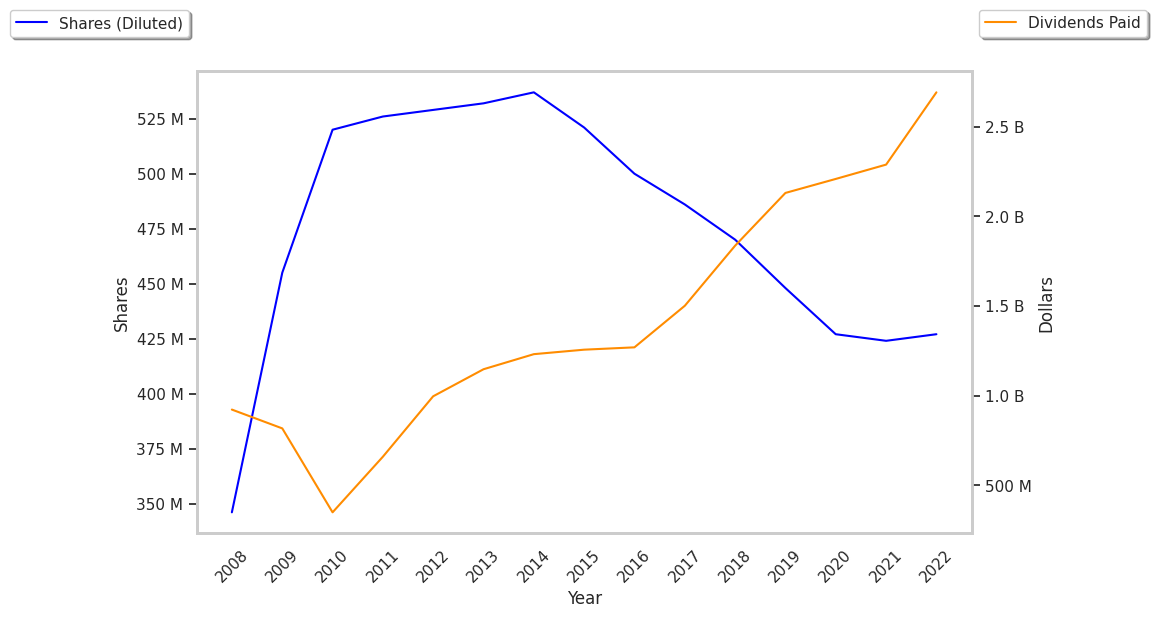
EPS Trend Sustained Primarily by Reducing the Number of Shares Outstanding:
| 2019 | 2020 | 2021 | 2022 | 2023 | 2024 | |
|---|---|---|---|---|---|---|
| Revenue (M) | $13,762 | $16,901 | $19,211 | $21,120 | $21,490 | $21,555 |
| Interest Income (M) | $9,965 | $9,946 | $10,647 | $13,014 | $13,916 | $13,499 |
| Operating Margins | 40% | 20% | 36% | 35% | 31% | 34% |
| Net Margins | 39% | 45% | 30% | 28% | 26% | 28% |
| Net Income (M) | $5,418 | $7,558 | $5,725 | $6,113 | $5,647 | $5,953 |
| Depreciation & Amort. (M) | $1,315 | $1,497 | $1,773 | $651 | $217 | $912 |
| Diluted Shares (M) | 448 | 427 | 426 | 412 | 401 | 400 |
| Earnings Per Share | $11.39 | $16.96 | $12.7 | $13.85 | $12.79 | $13.74 |
| EPS Growth | n/a | 48.9% | -25.12% | 9.06% | -7.65% | 7.43% |
| Avg. Price | $118.49 | $107.49 | $174.9 | $175.73 | $154.85 | $206.04 |
| P/E Ratio | 10.37 | 6.33 | 13.76 | 12.68 | 12.1 | 14.97 |
| Free Cash Flow (M) | $7,363 | $4,659 | $7,214 | $9,083 | $10,111 | $7,880 |
| EV / EBITDA | 8.05 | 9.23 | -0.13 | 12.05 | 12.07 | 11.94 |
| Total Debt (M) | $6,134 | $6,403 | $6,996 | $58,726 | $72,737 | $61,673 |
| Net Debt / EBITDA | 0.16 | -0.12 | -8.59 | 3.0 | 3.17 | 1.89 |
PNC Financial Services Is Trading Near Its Fair Value:
PNC Financial Services has a trailing twelve month P/E ratio of 13.1, compared to an average of 15.92 for the Finance sector. Based on its EPS guidance of $15.01, the company has a forward P/E ratio of 12.8. The 4.0% compound average growth rate of PNC Financial Services's historical and projected earnings per share yields a PEG ratio of 3.26. This suggests that these shares are overvalued. In contrast, the market is likely undervaluing PNC Financial Services in terms of its equity because its P/B ratio is 1.57 while the sector average is 1.78. The company's shares are currently trading 0.5% below their Graham number.
Analysts Give PNC Financial Services No Average Rating:
PNC Financial Services has a very low short interest because 1.7% of the company's shares are sold short. Institutions own 85.6% of the company's shares, and the insider ownership rate stands at 0.38%, suggesting a small amount of insider investors. The largest shareholder is Vanguard Group Inc, whose 10% stake in the company is worth $7,933,340,751.