Raytheon Technologies shares fell by -1.3% during the day's afternoon session, and are now trading at a price of $158.6. Is it time to buy the dip? To better answer that question, it's essential to check if the market is valuing the company's shares fairly in terms of its earnings and equity levels.
Raytheon Technologies's Valuation Is in Line With Its Sector Averages:
RTX Corporation, an aerospace and defense company, provides systems and services for the commercial, military, and government customers in the United States and internationally. The company belongs to the Industrials sector, which has an average price to earnings (P/E) ratio of 24.03 and an average price to book (P/B) ratio of 2.89. In contrast, Raytheon Technologies has a trailing 12 month P/E ratio of 34.9 and a P/B ratio of 3.4.
Raytheon Technologies has moved 31.1% over the last year compared to 16.8% for the S&P 500 — a difference of 14.2%. Raytheon Technologies has a 52 week high of $161.26 and a 52 week low of $112.27.
Increasing Revenues but Narrowing Margins:
| 2019 | 2020 | 2021 | 2022 | 2023 | 2024 | |
|---|---|---|---|---|---|---|
| Revenue (M) | $45,349 | $56,587 | $64,388 | $67,074 | $68,920 | $80,738 |
| Gross Margins | 20% | -3% | 8% | 8% | 5% | 8% |
| Net Margins | 12% | -6% | 6% | 8% | 5% | 6% |
| Net Income (M) | $5,537 | -$3,519 | $3,864 | $5,197 | $3,195 | $4,774 |
| Net Interest Expense (M) | $1,591 | $1,366 | $1,322 | $1,276 | $1,505 | $1,862 |
| Depreciation & Amort. (M) | $2,708 | $4,156 | $4,557 | $4,108 | $4,211 | $1,800 |
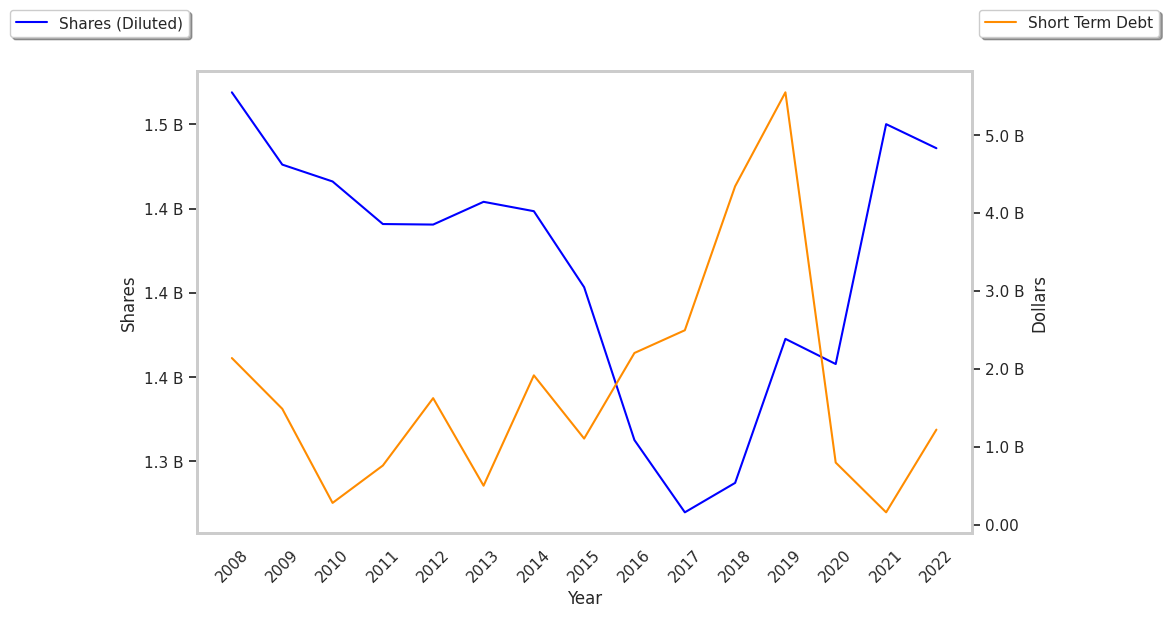
| Diluted Shares (M) | 864 | 1,358 | 1,508 | 1,486 | 1,435 | 1,344 |
| Earnings Per Share | $6.41 | -$2.59 | $2.56 | $3.5 | $2.23 | $3.55 |
| EPS Growth | n/a | -140.41% | 198.84% | 36.72% | -36.29% | 59.19% |
| Avg. Price | $59.76 | $59.32 | $78.81 | $92.68 | $84.14 | $158.6 |
| P/E Ratio | 9.22 | -22.9 | 30.67 | 26.33 | 37.56 | 44.3 |
| Free Cash Flow (M) | $3,953 | $2,539 | $5,008 | $4,880 | $5,468 | $4,534 |
| CAPEX (M) | $1,868 | $1,795 | $2,134 | $2,288 | $2,415 | $2,625 |
| EV / EBITDA | 11.51 | 32.69 | 14.78 | 17.0 | 20.63 | 29.78 |
| Total Debt (M) | $41,197 | $31,576 | $31,351 | $31,289 | $43,638 | $43,430 |
| Net Debt / EBITDA | 4.76 | 10.05 | 2.43 | 2.61 | 4.77 | 4.54 |
| Current Ratio | 1.32 | 1.21 | 1.19 | 1.09 | 1.04 | 0.99 |
Raytheon Technologies's financial statements include several red flags such as slimmer gross margins than its peers, declining EPS growth, and not enough current assets to cover current liabilities because its current ratio is 0.99. Additionally, the firm has a highly leveraged balance sheet. On the other hand, the company benefits from growing revenues and increasing reinvestment in the business and generally positive cash flows.