Now trading at a price of $63.49, Interactive Brokers has moved 2.0% so far today.
Interactive Brokers returned gains of 95.4% last year, with its stock price reaching a high of $68.07 and a low of $30.01. Over the same period, the stock outperformed the S&P 500 index by 78.6%. More recently, the company's 50-day average price was $61.0. Interactive Brokers Group, Inc. operates as an automated electronic broker in the United States and internationally. Based in Greenwich, CT, the Large-Cap Finance company has 3,087 full time employees. Interactive Brokers has offered a 0.4% dividend yield over the last 12 months.
The Company's Revenues Are Declining:
| 2019 | 2020 | 2021 | 2022 | 2023 | 2024 | |
|---|---|---|---|---|---|---|
| Revenue (M) | $2,580 | $1,287 | $1,568 | $1,506 | $1,557 | $1,977 |
| Interest Income (M) | $1,726 | $872 | $1,148 | $1,668 | $2,794 | $3,148 |
| Net Income (M) | $1,089 | $1,179 | $1,636 | $1,842 | $2,812 | $3,407 |
| Depreciation & Amort. (M) | $31 | $42 | $50 | $58 | $65 | $67 |
| Diluted Shares (M) | 77 | 81 | 95 | 101 | 106 | 109 |
| Earnings Per Share | $2.1 | $2.42 | $3.24 | $3.75 | $5.67 | $6.93 |
| EPS Growth | n/a | 15.24% | 33.88% | 15.74% | 51.2% | 22.22% |
| Avg. Price | $49.5 | $47.4 | $68.85 | $63.37 | $82.9 | $63.16 |
| P/E Ratio | 23.46 | 19.43 | 21.06 | 16.76 | 14.49 | 9.04 |
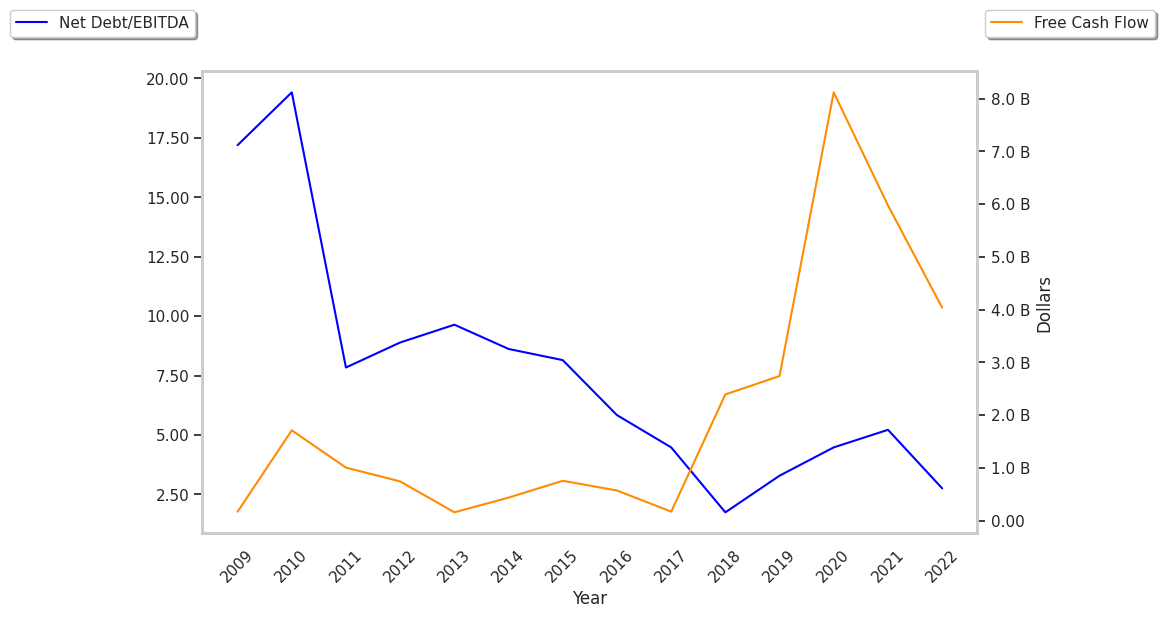
| Free Cash Flow (M) | $2,592 | $8,018 | $5,819 | $3,899 | $4,495 | $8,675 |
| CAPEX (M) | $74 | $50 | $77 | $69 | $49 | $49 |
Trades Below Its Fair Value but Has an Elevated P/B Ratio:
Interactive Brokers has a trailing twelve month P/E ratio of 32.1, compared to an average of 15.92 for the Finance sector. Based on its EPS guidance of $6.91, the company has a forward P/E ratio of 8.8. Interactive Brokers's PEG ratio is 2.44 on the basis of the 13.1% weighted average of the company and the broader market's EPS compound average growth rates. This suggests that the company's shares are overvalued. Furthermore, Interactive Brokers is likely overvalued compared to the book value of its equity, since its P/B ratio of 5.81 is higher than the sector average of 1.78. The company's shares are currently trading -18.9% above their Graham number. Ultimately, Interactive Brokers's strong cash flows, decent earnings multiple, and healthy debt levels factor towards it being fairly valued, its elevated P/B ratio notwithstanding.
There's an Analyst Consensus of Some Upside Potential for Interactive Brokers:
The 9 analysts following Interactive Brokers have set target prices ranging from $46.0 to $75.0 per share, for an average of $66.22 with a buy rating. The company is trading -4.1% away from its average target price, indicating that there is an analyst consensus of some upside potential.
Interactive Brokers has an average amount of shares sold short because 2.3% of the company's shares are sold short. Institutions own 86.9% of the company's shares, and the insider ownership rate stands at 2.83%, suggesting a large amount of insider shareholders. The largest shareholder is Vanguard Group Inc, whose 9% stake in the company is worth $2,654,668,109.