Iron Mountain logged a -3.4% change during today's afternoon session, and is now trading at a price of $89.22 per share.
Iron Mountain returned losses of -18.2% last year, with its stock price reaching a high of $130.24 and a low of $72.33. Over the same period, the stock underperformed the S&P 500 index by -35.0%. AThe company's 50-day average price was $96.54. Iron Mountain Incorporated (NYSE: IRM) is trusted by more than 240,000 customers in 61 countries, including approximately 95% of the Fortune 1000, to help unlock value and intelligence from their assets through services that transcend the physical and digital worlds. Based in Portsmouth, NH, the Large-Cap Real Estate company has 28,850 full time employees. Iron Mountain has returned a 3.2% dividend yield over the last 12 months, but this may not be sustainable seen that the company has a choppy cash flow record.
The Company Has a Highly Leveraged Balance Sheet and a Declining EPS Growth Trend:
| 2019 | 2020 | 2021 | 2022 | 2023 | 2024 | |
|---|---|---|---|---|---|---|
| Revenue (M) | $4,263 | $4,147 | $4,492 | $5,104 | $5,480 | $6,150 |
| Operating Margins | 18% | 23% | 19% | 21% | 17% | 16% |
| Net Margins | 6% | 8% | 10% | 11% | 3% | 3% |
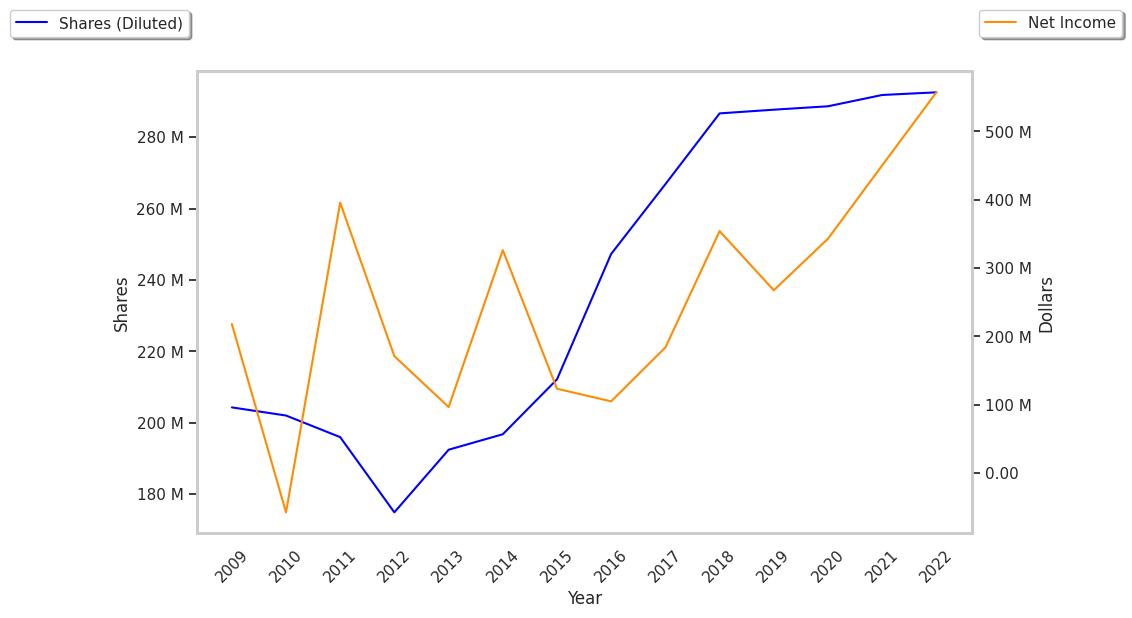
| Net Income (M) | $268 | $343 | $453 | $562 | $187 | $184 |
| Net Interest Expense (M) | -$419 | -$419 | -$418 | -$488 | -$586 | -$722 |
| Depreciation & Amort. (M) | $456 | $448 | $465 | $479 | $526 | $629 |
| Diluted Shares (M) | 288 | 289 | 291 | 292 | 294 | 296 |
| Earnings Per Share | $0.93 | $1.19 | $1.55 | $1.9 | $0.63 | $0.61 |
| EPS Growth | n/a | 27.96% | 30.25% | 22.58% | -66.84% | -3.17% |
| Avg. Price | $25.58 | $23.42 | $38.04 | $47.12 | $69.98 | $89.0 |
| P/E Ratio | 27.51 | 19.68 | 24.38 | 24.54 | 111.08 | 145.9 |
| Free Cash Flow (M) | $274 | $549 | $148 | $52 | -$226 | -$595 |
| CAPEX (M) | $693 | $438 | $611 | $875 | $1,339 | $1,792 |
| EV / EBITDA | 19.14 | 17.03 | 21.71 | 22.55 | 30.23 | 32.08 |
| Total Debt (M) | $16,551 | $17,019 | $17,925 | $20,963 | $23,625 | $26,723 |
| Net Debt / EBITDA | 13.22 | 12.16 | 13.39 | 13.62 | 16.17 | 16.21 |
| Current Ratio | 0.63 | 0.64 | 0.71 | 0.81 | 0.78 | 0.55 |
Iron Mountain suffers from weak operating margins with a stable trend, declining EPS growth, and positive cash flows. The firm's financial statements also exhibit not enough current assets to cover current liabilities because its current ratio is 0.55 and a highly leveraged balance sheet. On the other hand, the company has growing revenues and increasing reinvestment in the business working in its favor.
Iron Mountain's Valuation Is in Line With Its Sector Averages:
Iron Mountain has a trailing twelve month P/E ratio of 689.6, compared to an average of 27.31 for the Real Estate sector. Based on its EPS guidance of $1.96, the company has a forward P/E ratio of 49.3. The 11.2% compound average growth rate of Iron Mountain's historical and projected earnings per share yields a PEG ratio of 61.36. This suggests that these shares are overvalued.
Iron Mountain Has an Analyst Consensus of Strong Upside Potential:
The 10 analysts following Iron Mountain have set target prices ranging from $44.0 to $140.0 per share, for an average of $114.5 with a buy rating. The company is trading -22.1% away from its average target price, indicating that there is an analyst consensus of strong upside potential.
Iron Mountain has an average amount of shares sold short because 3.9% of the company's shares are sold short. Institutions own 85.4% of the company's shares, and the insider ownership rate stands at 0.79%, suggesting a small amount of insider investors. The largest shareholder is Vanguard Group Inc, whose 16% stake in the company is worth $4,199,143,279.