We've been asking ourselves recently if the market has placed a fair valuation on Nike. Let's dive into some of the fundamental values of this Large-Cap Consumer Discretionary company to determine if there might be an opportunity here for value-minded investors.
Nike's Valuation Is in Line With Its Sector Averages:
NIKE, Inc., together with its subsidiaries, designs, develops, markets, and sells athletic and casual footwear, apparel, equipment, accessories, and services for men, women, and kids in North America, Europe, the Middle East, Africa, Greater China, the Asia Pacific, and Latin America. The company belongs to the Consumer Discretionary sector, which has an average price to earnings (P/E) ratio of 20.93 and an average price to book (P/B) ratio of 2.93. In contrast, Nike has a trailing 12 month P/E ratio of 34.4 and a P/B ratio of 8.31.
Nike has moved -8.3% over the last year compared to 16.2% for the S&P 500 -- a difference of -24.5%. Nike has a 52 week high of $90.62 and a 52 week low of $52.28.
The Company's Revenues Are Declining:
| 2019 | 2020 | 2021 | 2022 | 2023 | 2024 | |
|---|---|---|---|---|---|---|
| Revenue (M) | $37,403 | $44,538 | $46,710 | $51,217 | $51,362 | $46,309 |
| Gross Margins | 43% | 45% | 46% | 44% | 45% | 43% |
| Net Margins | 7% | 13% | 13% | 10% | 11% | 7% |
| Net Income (M) | $2,539 | $5,727 | $6,046 | $5,070 | $5,700 | $3,219 |
| Net Interest Expense (M) | -$89 | -$262 | -$205 | $6 | $161 | $107 |
| Depreciation & Amort. (M) | $721 | $744 | $717 | $703 | $796 | $775 |
| Diluted Shares (M) | 1,610 | 1,617 | 1,572 | 1,532 | 1,490 | 1,488 |
| Earnings Per Share | $1.58 | $3.54 | $3.85 | $3.31 | $3.83 | $2.16 |
| EPS Growth | n/a | 124.05% | 8.76% | -14.03% | 15.71% | -43.6% |
| Avg. Price | $83.41 | $103.46 | $147.56 | $126.56 | $108.57 | $74.29 |
| P/E Ratio | 51.17 | 28.58 | 38.33 | 38.24 | 28.57 | 34.08 |
| Free Cash Flow (M) | $1,399 | $5,962 | $4,430 | $4,872 | $6,617 | $3,268 |
| CAPEX (M) | $1,086 | $695 | $758 | $969 | $812 | $430 |
| EV / EBITDA | 36.28 | 21.92 | 31.88 | 28.19 | 21.97 | 23.65 |
| Total Debt (M) | $9,412 | $9,413 | $9,920 | $8,927 | $9,903 | $7,961 |
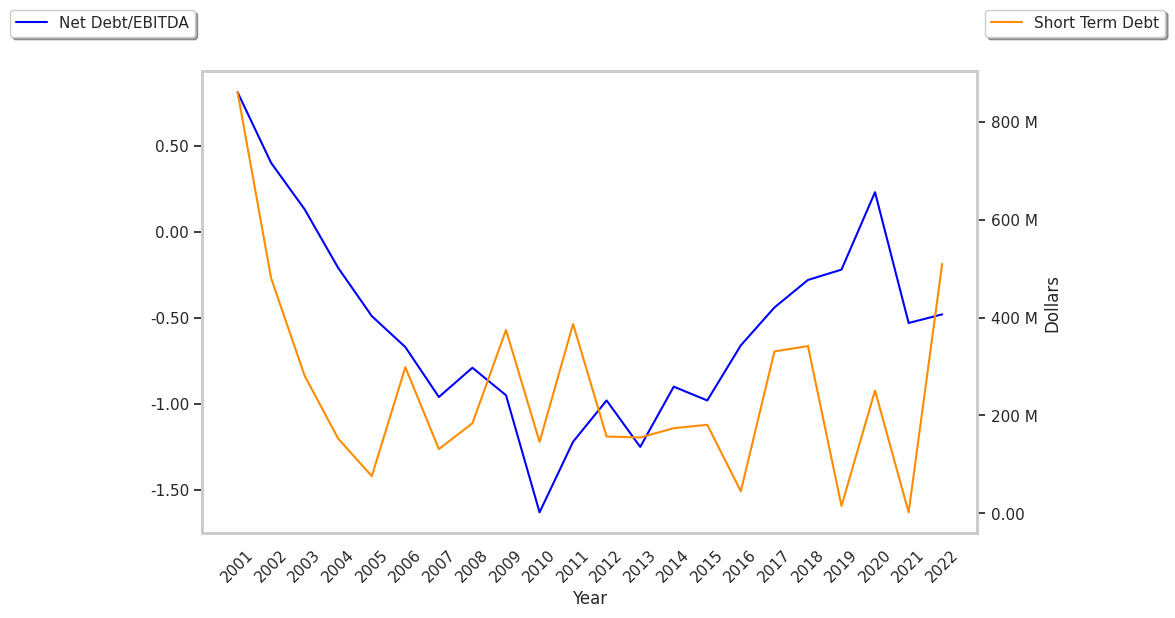
| Net Debt / EBITDA | 0.22 | -0.18 | 0.47 | 0.15 | 0.26 | 0.11 |
| Current Ratio | 2.66 | 3.07 | 2.69 | 2.74 | 2.22 | 2.21 |
Nike has an excellent current ratio of 2.21, positive EPS growth, and healthy leverage levels. However, the firm suffers from slight revenue growth and decreasing reinvestment in the business and slimmer gross margins than its peers. Finally, we note that Nike has positive cash flows.