Danaher logged a -2.2% change during today's morning session, and is now trading at a price of $195.09 per share.
Danaher returned losses of -24.7% last year, with its stock price reaching a high of $279.9 and a low of $171.0. Over the same period, the stock underperformed the S&P 500 index by -41.8%. AThe company's 50-day average price was $201.68. Danaher Corporation designs, manufactures, and markets professional, medical, research, and industrial products and services in the United States, China, and internationally. Based in Washington, DC, the Large-Cap Industrials company has 61,000 full time employees. Danaher has offered a 0.6% dividend yield over the last 12 months.
Wider Gross Margins Than the Industry Average of 36.97%:
| 2019 | 2020 | 2021 | 2022 | 2023 | 2024 | |
|---|---|---|---|---|---|---|
| Revenue (M) | $17,911 | $22,284 | $24,802 | $26,643 | $23,890 | $23,875 |
| Gross Margins | 56% | 56% | 61% | 61% | 59% | 60% |
| Net Margins | 17% | 16% | 26% | 27% | 20% | 16% |
| Net Income (M) | $3,008 | $3,646 | $6,433 | $7,209 | $4,764 | $3,899 |
| Net Interest Expense (M) | $108 | $275 | $231 | $204 | $286 | $370 |
| Depreciation & Amort. (M) | $564 | $637 | $674 | $698 | $675 | $721 |
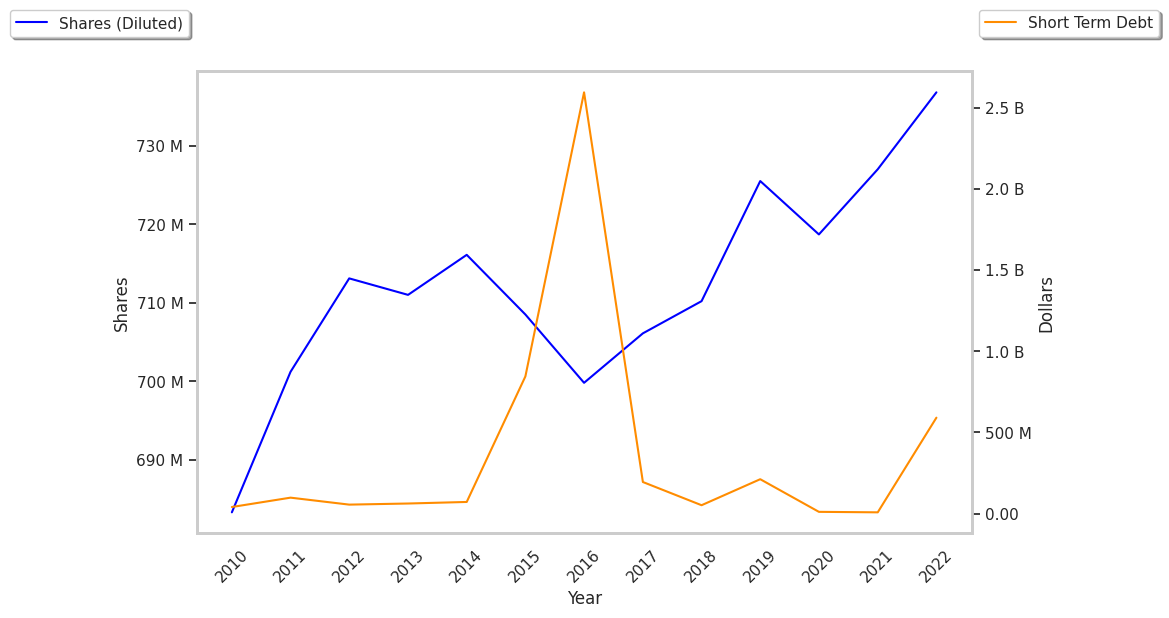
| Diluted Shares (M) | 726 | 719 | 737 | 737 | 743 | 737 |
| Earnings Per Share | $4.05 | $4.89 | $8.61 | $9.66 | $6.38 | $5.29 |
| EPS Growth | n/a | 20.74% | 76.07% | 12.2% | -33.95% | -17.08% |
| Avg. Price | $131.36 | $183.49 | $272.8 | $269.24 | $231.34 | $199.44 |
| P/E Ratio | 31.96 | 36.92 | 31.11 | 27.47 | 35.92 | 37.42 |
| Free Cash Flow (M) | $3,316 | $5,417 | $7,118 | $7,401 | $5,781 | $5,296 |
| CAPEX (M) | $636 | $791 | $1,240 | $1,118 | $1,383 | $1,392 |
| EV / EBITDA | 24.58 | 29.36 | 30.33 | 25.12 | 31.1 | 29.0 |
| Total Debt (M) | $21,941 | $21,215 | $22,184 | $20,268 | $20,097 | $16,510 |
| Net Debt / EBITDA | 0.53 | 3.12 | 2.78 | 1.73 | 2.42 | 2.58 |
| Current Ratio | 5.19 | 1.86 | 1.43 | 1.89 | 1.68 | 1.4 |
Danaher has growing revenues and increasing reinvestment in the business and wider gross margins than its peer group. Additionally, the company's financial statements display positive EPS growth and generally positive cash flows. Furthermore, Danaher has just enough current assets to cover current liabilities, as shown by its current ratio of 1.4 and significant leverage levels.
Danaher's Valuation Is in Line With Its Sector Averages:
Danaher has a trailing twelve month P/E ratio of 42.8, compared to an average of 24.03 for the Industrials sector. Based on its EPS guidance of $8.38, the company has a forward P/E ratio of 24.1. The 10.9% compound average growth rate of Danaher's historical and projected earnings per share yields a PEG ratio of 3.91. This suggests that these shares are overvalued. In contrast, the market is likely undervaluing Danaher in terms of its equity because its P/B ratio is 2.67 while the sector average is 2.89. The company's shares are currently trading 118.1% below their Graham number.
Danaher Has an Analyst Consensus of Strong Upside Potential:
The 20 analysts following Danaher have set target prices ranging from $205.0 to $310.0 per share, for an average of $245.5 with a buy rating. The company is trading -20.5% away from its average target price, indicating that there is an analyst consensus of strong upside potential.
Danaher has a very low short interest because 1.5% of the company's shares are sold short. Institutions own 82.7% of the company's shares, and the insider ownership rate stands at 11.05%, suggesting a large amount of insider shareholders. The largest shareholder is Vanguard Group Inc, whose 8% stake in the company is worth $11,855,538,505.