Occidental Petroleum may be undervalued with mixed growth prospects, but the 23 analysts following the company give it an rating of hold. Their target prices range from $40.0 to $64.0 per share, for an average of $50.61. At today's price of $46.09, Occidental Petroleum is trading -8.92% away from its average target price, suggesting there is an analyst consensus of some upside potential for the stock.
Occidental Petroleum Corporation, together with its subsidiaries, engages in the acquisition, exploration, and development of oil and gas properties in the United States and internationally. Based in Houston, TX, the Large-Cap Energy company has 13,323 full time employees. Occidental Petroleum has provided a 2.0% dividend yield over the last 12 months.
Occidental Petroleum has a trailing twelve month P/E ratio of 27.1, compared to an average of 18.35 for the Energy sector. Considering its EPS guidance of $3.16, the company has a forward P/E ratio of 14.6.
The market is placing a reasonable value on Occidental Petroleum's book value, since its P/B ratio of 1.65 is comparable to its sector average of 1.6. The company's shares are currently 4.7% below their Graham number, indicating that its shares have a margin of safety.
| 2019 | 2020 | 2021 | 2022 | 2023 | 2024 | |
|---|---|---|---|---|---|---|
| Revenue (M) | $20,911 | $17,809 | $25,956 | $36,634 | $28,257 | $26,725 |
| Operating Margins | 2% | -88% | 14% | 39% | 23% | 15% |
| Net Margins | -5% | -83% | 9% | 36% | 17% | 12% |
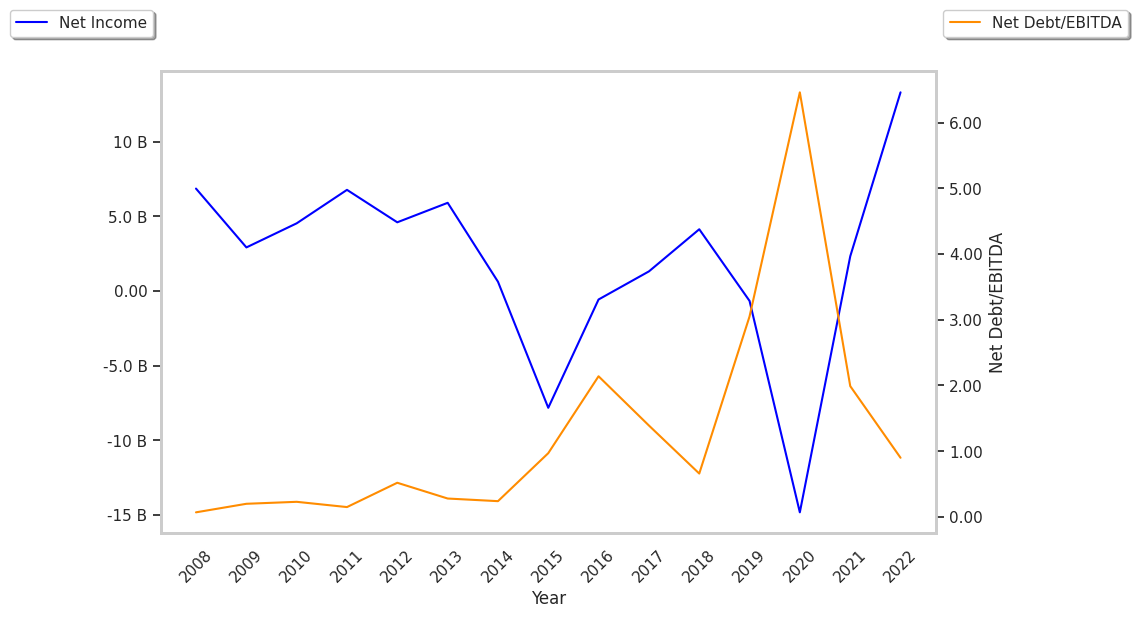
| Net Income (M) | -$985 | -$14,831 | $2,322 | $13,304 | $4,696 | $3,078 |
| Net Interest Expense (M) | $1,066 | $1,424 | $1,614 | $1,030 | $945 | $1,175 |
| Depreciation & Amort. (M) | $6,140 | $8,097 | $8,447 | $6,926 | $6,865 | $7,371 |
| Diluted Shares (M) | 810 | 919 | 959 | 1,002 | 961 | 967 |
| Earnings Per Share | -$1.22 | -$17.06 | $1.58 | $12.4 | $3.9 | $2.44 |
| EPS Growth | n/a | -1298.36% | 109.26% | 684.81% | -68.55% | -37.44% |
| Avg. Price | $46.16 | $18.26 | $27.1 | $52.46 | $59.71 | $46.3 |
| P/E Ratio | -37.84 | -1.07 | 16.73 | 3.91 | 14.15 | 17.88 |
| Free Cash Flow (M) | $1,008 | $1,420 | $7,564 | $12,313 | $6,038 | $4,421 |
| CAPEX (M) | $6,367 | $2,535 | $2,870 | $4,497 | $6,270 | $7,018 |
| EV / EBITDA | 10.81 | -6.65 | 4.29 | 3.22 | 5.42 | 5.69 |
| Total Debt (M) | $38,639 | $36,267 | $29,617 | $19,835 | $19,738 | $26,461 |
| Net Debt / EBITDA | 5.48 | -4.5 | 2.21 | 0.9 | 1.38 | 2.13 |
| Current Ratio | 1.15 | 1.07 | 1.23 | 1.15 | 0.92 | 0.95 |