We've been asking ourselves recently if the market has placed a fair valuation on Starbucks. Let's dive into some of the fundamental values of this Large-Cap Consumer Discretionary company to determine if there might be an opportunity here for value-minded investors.
Starbucks's Valuation Is in Line With Its Sector Averages:
Starbucks Corporation, together with its subsidiaries, operates as a roaster, marketer, and retailer of coffee worldwide. The company belongs to the Consumer Discretionary sector, which has an average price to earnings (P/E) ratio of 20.93. In contrast, Starbucks has a trailing 12 month P/E ratio of 37.8 based on its earnings per share of $2.31.
Starbucks has moved -4.7% over the last year compared to 17.2% for the S&P 500 -- a difference of -21.9%. Starbucks has a 52 week high of $117.46 and a 52 week low of $75.5.
EPS Trend Sustained Primarily by Reducing the Number of Shares Outstanding:
| 2019 | 2020 | 2021 | 2022 | 2023 | 2024 | |
|---|---|---|---|---|---|---|
| Revenue (M) | $26,509 | $23,518 | $29,061 | $32,250 | $35,976 | $36,176 |
| Operating Margins | 15% | 7% | 17% | 14% | 16% | 15% |
| Net Margins | 14% | 4% | 14% | 10% | 11% | 10% |
| Net Income (M) | $3,599 | $928 | $4,199 | $3,282 | $4,124 | $3,761 |
| Net Interest Expense (M) | $331 | $437 | $470 | $483 | $550 | $562 |
| Depreciation & Amort. (M) | $1,377 | $1,431 | $1,442 | $1,448 | $1,363 | $1,513 |
| Diluted Shares (M) | 1,191 | 1,183 | 1,186 | 1,158 | 1,141 | 1,138 |
| Earnings Per Share | $3.02 | $0.78 | $3.54 | $2.83 | $3.62 | $3.3 |
| EPS Growth | n/a | -74.17% | 353.85% | -20.06% | 27.92% | -8.84% |
| Avg. Price | $75.3 | $78.1 | $107.51 | $83.01 | $96.01 | $87.25 |
| P/E Ratio | 24.69 | 98.86 | 30.03 | 29.02 | 26.45 | 26.28 |
| Free Cash Flow (M) | $3,240 | $114 | $4,519 | $2,556 | $3,675 | $3,318 |
| CAPEX (M) | $1,807 | $1,484 | $1,470 | $1,841 | $2,334 | $2,778 |
| EV / EBITDA | 17.79 | 39.0 | 23.43 | 19.86 | 18.57 | 18.08 |
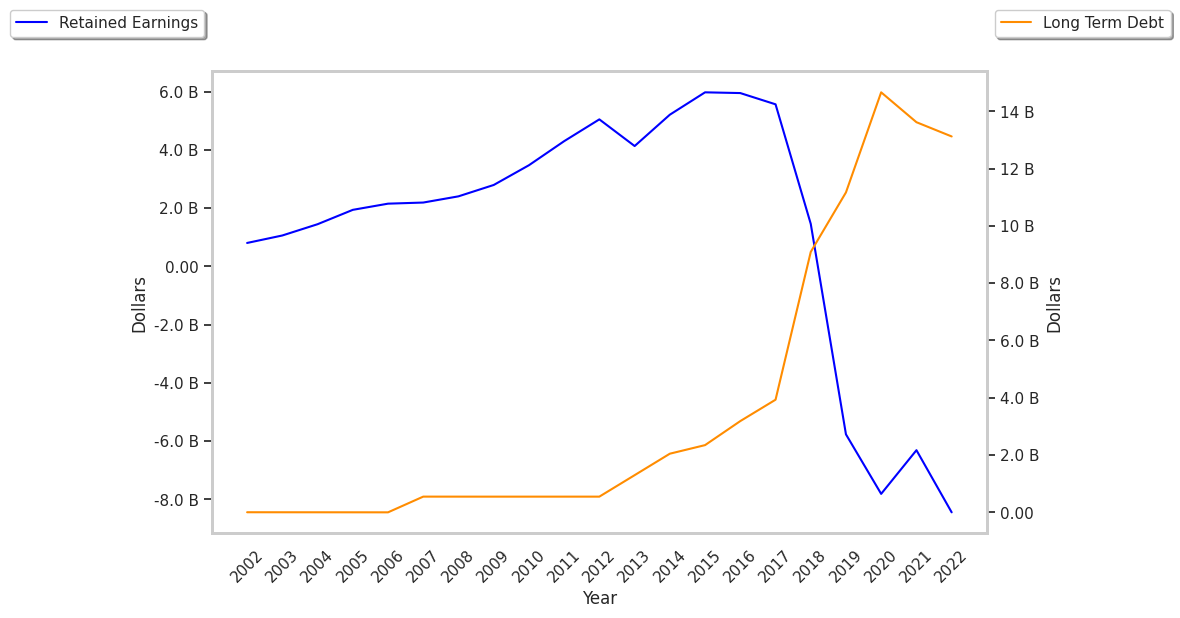
| Total Debt (M) | $11,152 | $30,083 | $28,233 | $27,989 | $28,213 | $29,881 |
| Net Debt / EBITDA | 1.49 | 8.37 | 3.45 | 4.15 | 3.49 | 3.79 |
| Current Ratio | 0.68 | 1.06 | 1.2 | 0.77 | 0.7 | 0.75 |
Starbucks has growing revenues and increasing reinvestment in the business, strong operating margins with a stable trend, and generally positive cash flows. However, Starbucks has EPS growth achieved by reducing the number of outstanding shares, not enough current assets to cover current liabilities because its current ratio is 0.75, and a highly leveraged balance sheet.