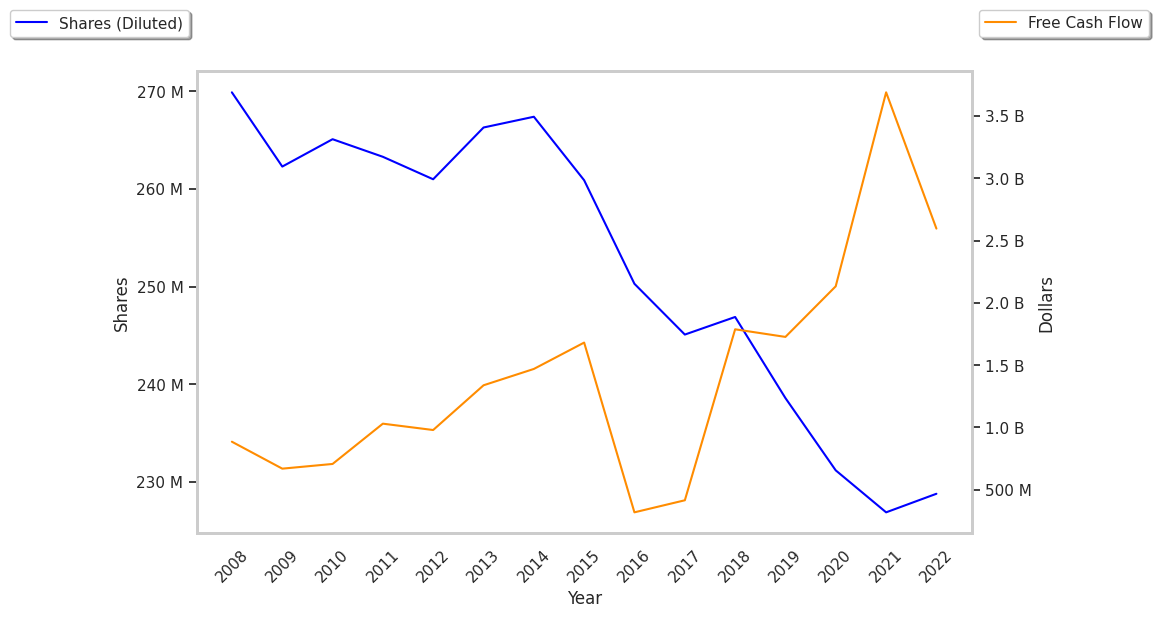
Large-cap Finance company T. Rowe Price has logged a 5.7% change today on a trading volume of 4,305,633. The average volume for the stock is 1,474,711.
T. Rowe Price Group, Inc. is a publicly owned investment manager. Based in Baltimore, United States the company has 8,063 full time employees and a market cap of $24,474,054,656. T. Rowe Price currently offers its equity investors a dividend that yields 4.8% per year.
Over the last 52 weeks, TROW stock has risen 1.2%, which amounts to a -16.0% difference compared to the S&P 500. The stock's 52 week high is $125.81 whereas its 52 week low is $77.85 per share. With its net margins declining an average -4.1% over the last 6 years, T. Rowe Price may not have a strong enough profitability trend to support its stock price.
| Date Reported | Total Revenue ($ k) | Net Profit ($ k) | Net Margins (%) | YoY Growth (%) |
|---|---|---|---|---|
| 2024 | 7,093,600 | 2,100,100 | 30 | 7.14 |
| 2023 | 6,460,500 | 1,788,700 | 28 | 16.67 |
| 2022 | 6,488,400 | 1,557,900 | 24 | -40.0 |
| 2021 | 7,671,900 | 3,082,900 | 40 | 5.26 |
| 2020 | 6,206,700 | 2,372,700 | 38 | 0.0 |
| 2019 | 5,617,900 | 2,131,300 | 38 |


