It hasn't been a great afternoon session for Microsoft investors, who have watched their shares sink by -2.9% to a price of $493.35. Some of you might be wondering if it's time to buy the dip. If you are considering this, make sure to check the company's fundamentals first to determine if the shares are fairly valued at today's prices.
Microsoft's Valuation Is in Line With Its Sector Averages:
Microsoft Corporation develops and supports software, services, devices, and solutions worldwide. The company belongs to the Technology sector, which has an average price to earnings (P/E) ratio of 30.44 and an average price to book (P/B) ratio of 4.19. In contrast, Microsoft has a trailing 12 month P/E ratio of 36.1 and a P/B ratio of 10.68.
Microsoft has moved 26.5% over the last year compared to 20.2% for the S&P 500 -- a difference of 6.2%. Microsoft has a 52 week high of $555.45 and a 52 week low of $344.79.
Strong Revenue Growth but an Average Current Ratio:
| 2020 | 2021 | 2022 | 2023 | 2024 | 2025 | |
|---|---|---|---|---|---|---|
| Revenue (M) | $143,015 | $168,088 | $198,270 | $211,915 | $245,122 | $281,724 |
| Gross Margins | 68% | 69% | 68% | 69% | 70% | 69% |
| Net Margins | 31% | 36% | 37% | 34% | 36% | 36% |
| Net Income (M) | $44,281 | $61,271 | $72,738 | $72,361 | $88,136 | $101,832 |
| Net Interest Expense (M) | $2,591 | $2,346 | $2,063 | $1,968 | $2,935 | $1,600 |
| Depreciation & Amort. (M) | $12,796 | $11,686 | $14,460 | $13,861 | $22,287 | $22,000 |
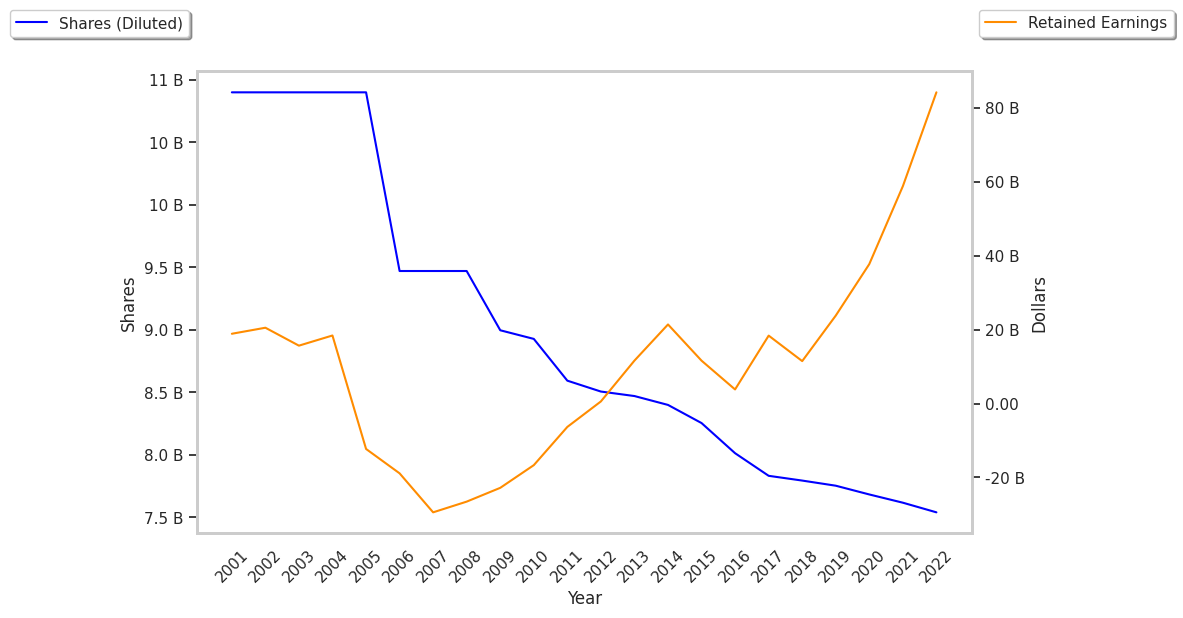
| Diluted Shares (M) | 7,616 | 7,555 | 7,473 | 7,468 | 7,468 | 7,465 |
| Earnings Per Share | $5.76 | $8.05 | $9.65 | $9.68 | $11.8 | $13.64 |
| EPS Growth | n/a | 39.76% | 19.88% | 0.31% | 21.9% | 15.59% |
| Avg. Price | $187.81 | $271.09 | $281.91 | $376.04 | $493.11 | $493.11 |
| P/E Ratio | 32.27 | 33.39 | 29.06 | 38.69 | 41.58 | 35.99 |
| Free Cash Flow (M) | $45,234 | $56,118 | $65,149 | $59,475 | $74,071 | $71,611 |
| CAPEX (M) | $15,441 | $20,622 | $23,886 | $28,107 | $44,477 | $64,551 |
| EV / EBITDA | 22.37 | 25.46 | 21.85 | 27.63 | 28.05 | 24.46 |
| Total Debt (M) | $64,272 | $61,330 | $50,865 | $52,425 | $47,219 | $46,150 |
| Net Debt / EBITDA | 0.76 | 0.5 | 0.36 | 0.34 | 0.23 | 0.11 |
| Current Ratio | 2.58 | 2.25 | 1.93 | 1.22 | 1.35 | 1.35 |
Microsoft has rapidly growing revenues and increasing reinvestment in the business and generally positive cash flows. Additionally, the company's financial statements display a strong EPS growth trend and healthy leverage levels. Furthermore, Microsoft has similar gross margins to its peers and just enough current assets to cover current liabilities, as shown by its current ratio of 1.35.