Eli Lilly and shares fell by -2.1% during the day's morning session, and are now trading at a price of $727.21. Is it time to buy the dip? To better answer that question, it's essential to check if the market is valuing the company's shares fairly in terms of its earnings and equity levels.
Eli Lilly and's Valuation Is in Line With Its Sector Averages:
Eli Lilly and Company discovers, develops, and markets human pharmaceuticals in the United States, Europe, China, Japan, and internationally. The company belongs to the Health Care sector, which has an average price to earnings (P/E) ratio of 22.94 and an average price to book (P/B) ratio of 3.19. In contrast, Eli Lilly and has a trailing 12 month P/E ratio of 47.6 and a P/B ratio of 35.69.
Eli Lilly and has moved -19.9% over the last year compared to 18.5% for the S&P 500 -- a difference of -38.4%. Eli Lilly and has a 52 week high of $942.35 and a 52 week low of $623.78.
Strong Revenue Growth but an Average Current Ratio:
| 2019 | 2020 | 2021 | 2022 | 2023 | 2024 | |
|---|---|---|---|---|---|---|
| Revenue (M) | $22,320 | $24,540 | $28,318 | $28,541 | $34,124 | $45,043 |
| Operating Margins | 24% | 28% | 22% | 24% | 19% | 28% |
| Net Margins | 37% | 25% | 20% | 22% | 15% | 24% |
| Net Income (M) | $8,318 | $6,194 | $5,582 | $6,245 | $5,240 | $10,590 |
| Net Interest Expense (M) | $401 | $360 | $340 | $332 | $486 | $578 |
| Depreciation & Amort. (M) | $1,233 | $1,324 | $1,548 | $1,522 | $1,527 | $1,058 |
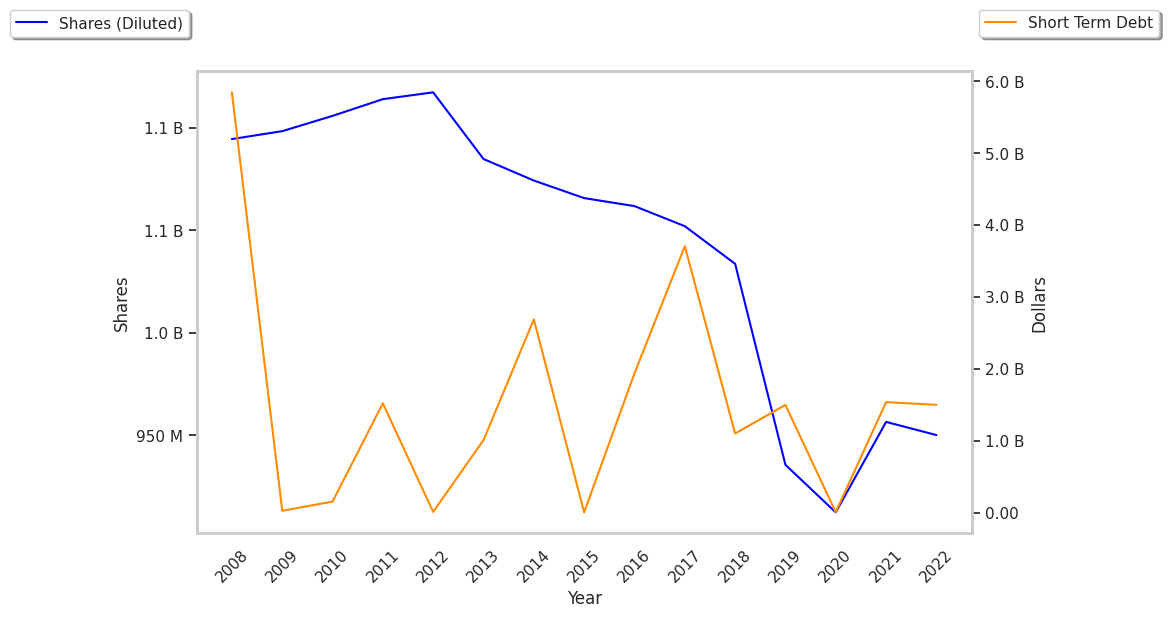
| Diluted Shares (M) | 936 | 913 | 912 | 905 | 903 | 904 |
| Earnings Per Share | $8.89 | $6.79 | $6.12 | $6.9 | $5.8 | $11.71 |
| EPS Growth | n/a | -23.62% | -9.87% | 12.75% | -15.94% | 101.9% |
| Avg. Price | $109.18 | $142.41 | $218.96 | $276.53 | $582.92 | $727.21 |
| P/E Ratio | 12.23 | 20.88 | 35.6 | 39.9 | 100.16 | 61.84 |
| Free Cash Flow (M) | $3,803 | $5,112 | $6,056 | $5,731 | $792 | $3,760 |
| CAPEX (M) | $1,034 | $1,388 | $1,310 | $1,854 | $3,448 | $5,058 |
| EV / EBITDA | 19.37 | 17.41 | 29.12 | 33.33 | 71.41 | 52.57 |
| Total Debt (M) | $15,138 | $16,357 | $18,280 | $16,316 | $26,009 | $34,591 |
| Net Debt / EBITDA | 1.97 | 1.48 | 1.88 | 1.71 | 2.87 | 2.28 |
| Current Ratio | 1.16 | 1.4 | 1.23 | 1.05 | 0.94 | 1.15 |
Eli Lilly and has rapidly growing revenues and increasing reinvestment in the business and strong operating margins with a stable trend. Additionally, the company's financial statements display positive EPS growth and healthy leverage levels. Furthermore, Eli Lilly and has positive cash flows and just enough current assets to cover current liabilities, as shown by its current ratio of 1.15.