Raytheon Technologies logged a -2.2% change during today's afternoon session, and is now trading at a price of $154.12 per share.
Raytheon Technologies returned gains of 30.0% last year, with its stock price reaching a high of $161.26 and a low of $112.27. Over the same period, the stock outperformed the S&P 500 index by 11.5%. More recently, the company's 50-day average price was $153.31. RTX Corporation, an aerospace and defense company, provides systems and services for the commercial, military, and government customers in the United States and internationally. Based in Arlington, VA, the Large-Cap Industrials company has 186,000 full time employees. Raytheon Technologies has offered a 1.6% dividend yield over the last 12 months.
Increasing Revenues but Narrowing Margins:
| 2019 | 2020 | 2021 | 2022 | 2023 | 2024 | |
|---|---|---|---|---|---|---|
| Revenue (M) | $45,349 | $56,587 | $64,388 | $67,074 | $68,920 | $80,738 |
| Gross Margins | 20% | -3% | 8% | 8% | 5% | 8% |
| Net Margins | 12% | -6% | 6% | 8% | 5% | 6% |
| Net Income (M) | $5,537 | -$3,519 | $3,864 | $5,197 | $3,195 | $4,774 |
| Net Interest Expense (M) | $1,591 | $1,366 | $1,322 | $1,276 | $1,505 | $1,862 |
| Depreciation & Amort. (M) | $2,708 | $4,156 | $4,557 | $4,108 | $4,211 | $1,800 |
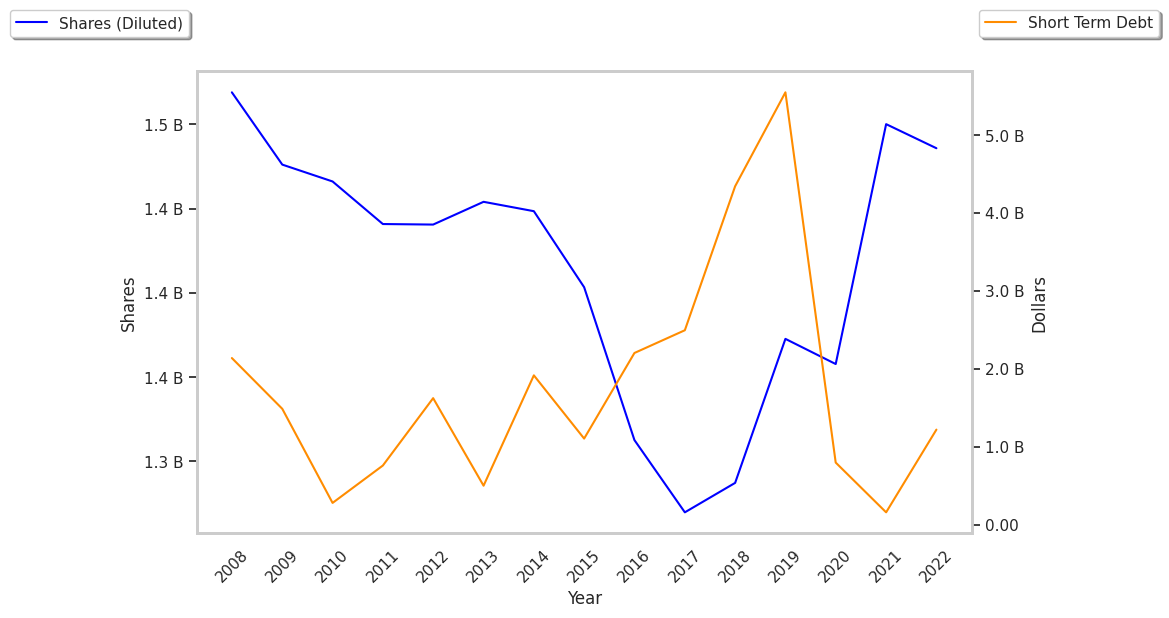
| Diluted Shares (M) | 864 | 1,358 | 1,508 | 1,486 | 1,435 | 1,344 |
| Earnings Per Share | $6.41 | -$2.59 | $2.56 | $3.5 | $2.23 | $3.55 |
| EPS Growth | n/a | -140.41% | 198.84% | 36.72% | -36.29% | 59.19% |
| Avg. Price | $59.76 | $59.32 | $78.81 | $92.68 | $84.14 | $154.74 |
| P/E Ratio | 9.22 | -22.9 | 30.67 | 26.33 | 37.56 | 43.22 |
| Free Cash Flow (M) | $3,953 | $2,539 | $5,008 | $4,880 | $5,468 | $4,534 |
| CAPEX (M) | $1,868 | $1,795 | $2,134 | $2,288 | $2,415 | $2,625 |
| EV / EBITDA | 11.51 | 32.69 | 14.78 | 17.0 | 20.63 | 29.16 |
| Total Debt (M) | $41,197 | $31,576 | $31,351 | $31,289 | $43,638 | $43,430 |
| Net Debt / EBITDA | 4.76 | 10.05 | 2.43 | 2.61 | 4.77 | 4.54 |
| Current Ratio | 1.32 | 1.21 | 1.19 | 1.09 | 1.04 | 0.99 |
Raytheon Technologies's financial statements include several red flags such as slimmer gross margins than its peers, declining EPS growth, and not enough current assets to cover current liabilities because its current ratio is 0.99. Additionally, the firm has a highly leveraged balance sheet. On the other hand, the company benefits from growing revenues and increasing reinvestment in the business and generally positive cash flows.
Raytheon Technologies's Valuation Is in Line With Its Sector Averages:
Raytheon Technologies has a trailing twelve month P/E ratio of 33.7, compared to an average of 24.03 for the Industrials sector. Based on its EPS guidance of $6.11, the company has a forward P/E ratio of 25.1. The -0.7% compound average growth rate of Raytheon Technologies's historical and projected earnings per share yields a PEG ratio of -49.37. This indicates that its shares are overvalued.Furthermore, Raytheon Technologies is likely overvalued compared to the book value of its equity, since its P/B ratio of 3.31 is higher than the sector average of 2.89. The company's shares are currently trading 157.7% below their Graham number.
Raytheon Technologies Has an Average Rating of Buy:
The 19 analysts following Raytheon Technologies have set target prices ranging from $134.0 to $180.0 per share, for an average of $163.68 with a buy rating. The company is trading -5.8% away from its average target price, indicating that there is an analyst consensus of some upside potential.
Raytheon Technologies has a very low short interest because 1.3% of the company's shares are sold short. Institutions own 83.3% of the company's shares, and the insider ownership rate stands at 0.08%, suggesting a small amount of insider investors. The largest shareholder is Vanguard Group Inc, whose 9% stake in the company is worth $18,814,768,377.