Honeywell International logged a 1.0% change during today's morning session, and is now trading at a price of $213.79 per share.
Over the last year, Honeywell International logged a 3.4% change, with its stock price reaching a high of $242.77 and a low of $179.36. Over the same period, the stock underperformed the S&P 500 index by -13.3%. AThe company's 50-day average price was $224.85. Honeywell International Inc. engages in the aerospace technologies, industrial automation, building automation, and energy and sustainable solutions businesses in the United States, Europe, and internationally. Based in Charlotte, NC, the Large-Cap Industrials company has 102,000 full time employees. Honeywell International has offered a 2.1% dividend yield over the last 12 months.
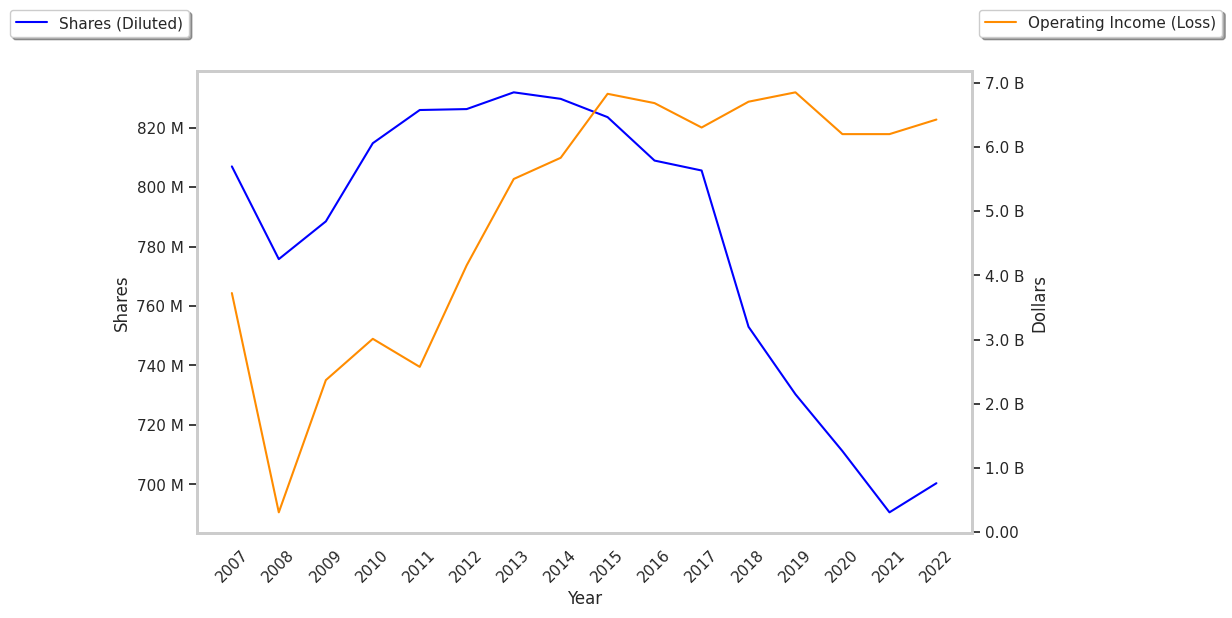
EPS Trend Sustained Primarily by Reducing the Number of Shares Outstanding:
| 2019 | 2020 | 2021 | 2022 | 2023 | 2024 | |
|---|---|---|---|---|---|---|
| Revenue (M) | $36,709 | $32,637 | $34,392 | $35,466 | $36,662 | $38,498 |
| Operating Margins | 21% | 18% | 21% | 18% | 20% | 23% |
| Net Margins | 17% | 15% | 16% | 14% | 15% | 15% |
| Net Income (M) | $6,143 | $4,779 | $5,542 | $4,966 | $5,658 | $5,705 |
| Net Interest Expense (M) | $357 | $359 | $343 | $414 | $765 | $1,058 |
| Depreciation & Amort. (M) | $673 | $644 | $674 | $657 | $659 | $671 |
| Diluted Shares (M) | 730 | 711 | 700 | 683 | 668 | 655 |
| Earnings Per Share | $8.41 | $6.72 | $7.91 | $7.27 | $8.47 | $8.71 |
| EPS Growth | n/a | -20.1% | 17.71% | -8.09% | 16.51% | 2.83% |
| Avg. Price | $152.22 | $154.5 | $209.7 | $187.8 | $209.71 | $211.7 |
| P/E Ratio | 17.87 | 22.75 | 26.18 | 25.62 | 24.58 | 24.17 |
| Free Cash Flow (M) | $6,058 | $5,302 | $5,143 | $4,508 | $4,301 | $4,933 |
| CAPEX (M) | $839 | $906 | $895 | $766 | $1,039 | $1,164 |
| EV / EBITDA | 13.9 | 17.22 | 19.09 | 19.33 | 19.26 | 16.61 |
| Total Debt (M) | $12,486 | $18,787 | $16,057 | $16,853 | $18,358 | $28,173 |
| Net Debt / EBITDA | 0.42 | 0.68 | 0.64 | 1.03 | 1.33 | 1.88 |
| Current Ratio | 1.34 | 1.47 | 1.3 | 1.25 | 1.27 | 1.31 |
Honeywell International has slight revenue growth and increasing reinvestment in the business, decent operating margins with a stable trend, and healthy leverage levels. However, the firm has EPS growth achieved by reducing the number of outstanding shares. Finally, we note that Honeywell International has positive cash flows and just enough current assets to cover current liabilities, as shown by its current ratio of 1.31.
Forward Earnings Expected to Increase but Priced Beyond Its Margin of Safety:
Honeywell International has a trailing twelve month P/E ratio of 25.6, compared to an average of 24.03 for the Industrials sector. Based on its EPS guidance of $11.01, the company has a forward P/E ratio of 20.4. The 3.9% compound average growth rate of Honeywell International's historical and projected earnings per share yields a PEG ratio of 6.52. This suggests that these shares are overvalued. Furthermore, Honeywell International is likely overvalued compared to the book value of its equity, since its P/B ratio of 8.43 is higher than the sector average of 2.89. The company's shares are currently trading 186.5% below their Graham number. Ultimately, Honeywell International's strong cash flows, decent earnings multiple, and healthy debt levels factor towards it being fairly valued, its elevated P/B ratio notwithstanding.
Honeywell International Has an Average Rating of Buy:
The 21 analysts following Honeywell International have set target prices ranging from $210.0 to $290.0 per share, for an average of $252.97 with a buy rating. The company is trading -15.5% away from its average target price, indicating that there is an analyst consensus of some upside potential.
Honeywell International has a very low short interest because 1.2% of the company's shares are sold short. Institutions own 81.0% of the company's shares, and the insider ownership rate stands at 0.1%, suggesting a small amount of insider investors. The largest shareholder is Vanguard Group Inc, whose 9% stake in the company is worth $13,322,526,275.