It hasn't been a great morning session for Synopsys investors, who have watched their shares sink by -2.3% to a price of $428.0. Some of you might be wondering if it's time to buy the dip. If you are considering this, make sure to check the company's fundamentals first to determine if the shares are fairly valued at today's prices.
a Lower P/B Ratio Than Its Sector Average but Priced at a Premium:
Synopsys, Inc. provides electronic design automation software products used to design and test integrated circuits. The company belongs to the Technology sector, which has an average price to earnings (P/E) ratio of 30.44 and an average price to book (P/B) ratio of 4.19. In contrast, Synopsys has a trailing 12 month P/E ratio of 57.8 and a P/B ratio of 2.87.
Synopsys has moved -10.6% over the last year compared to 17.1% for the S&P 500 — a difference of -27.7%. Synopsys has a 52 week high of $651.73 and a 52 week low of $365.74.
Wider Gross Margins Than the Industry Average of 63.49%:
| 2019 | 2020 | 2021 | 2022 | 2023 | 2024 | |
|---|---|---|---|---|---|---|
| Revenue (M) | $3,361 | $3,685 | $4,204 | $4,616 | $5,318 | $6,127 |
| Gross Margins | 78% | 78% | 80% | 81% | 81% | 80% |
| Net Margins | 16% | 18% | 18% | 21% | 23% | 37% |
| Net Income (M) | $532 | $664 | $758 | $985 | $1,230 | $2,263 |
| Net Interest Expense (M) | $12 | $5 | $3 | $2 | $1 | $67 |
| Depreciation & Amort. (M) | $202 | $210 | $204 | $228 | $247 | $163 |
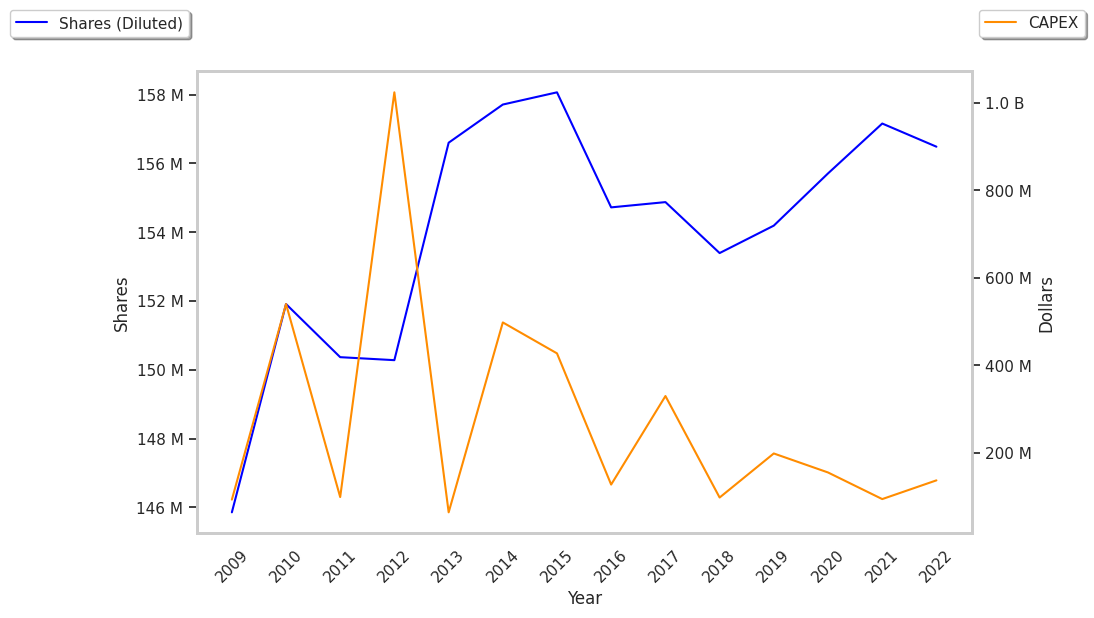
| Diluted Shares (M) | 154 | 156 | 157 | 156 | 155 | 156 |
| Earnings Per Share | $3.45 | $4.27 | $4.81 | $6.29 | $7.92 | $14.51 |
| EPS Growth | n/a | 23.77% | 12.65% | 30.77% | 25.91% | 83.21% |
| Avg. Price | $123.24 | $185.8 | $287.66 | $307.02 | $514.91 | $438.1 |
| P/E Ratio | 34.72 | 42.23 | 58.0 | 47.67 | 63.73 | 29.64 |
| Free Cash Flow (M) | $602 | $837 | $1,399 | $1,602 | $1,514 | $1,284 |
| CAPEX (M) | $198 | $155 | $94 | $137 | $190 | $123 |
| EV / EBITDA | 24.88 | 32.92 | 45.61 | 32.97 | 50.54 | 42.04 |
| Total Debt (M) | $138 | $128 | $100 | $21 | $18 | $16 |
| Net Debt / EBITDA | -0.82 | -1.33 | -1.42 | -1.01 | -0.93 | -2.56 |
| Current Ratio | 0.99 | 1.19 | 1.16 | 1.09 | 1.15 | 2.44 |
Synopsys has exceptional EPS growth, generally positive cash flows, and an excellent current ratio of 2.44. The company also benefits from rapidly growing revenues and decreasing reinvestment in the business, wider gross margins than its peer group, and healthy leverage levels.