Today we're going to take a closer look at Large-Cap Real Estate company Crown Castle, whose shares are currently trading at $93.44. We've been asking ourselves whether the company is under or over valued at today's prices... let's perform a brief value analysis to find out!
Crown Castle's Valuation Is in Line With Its Sector Averages:
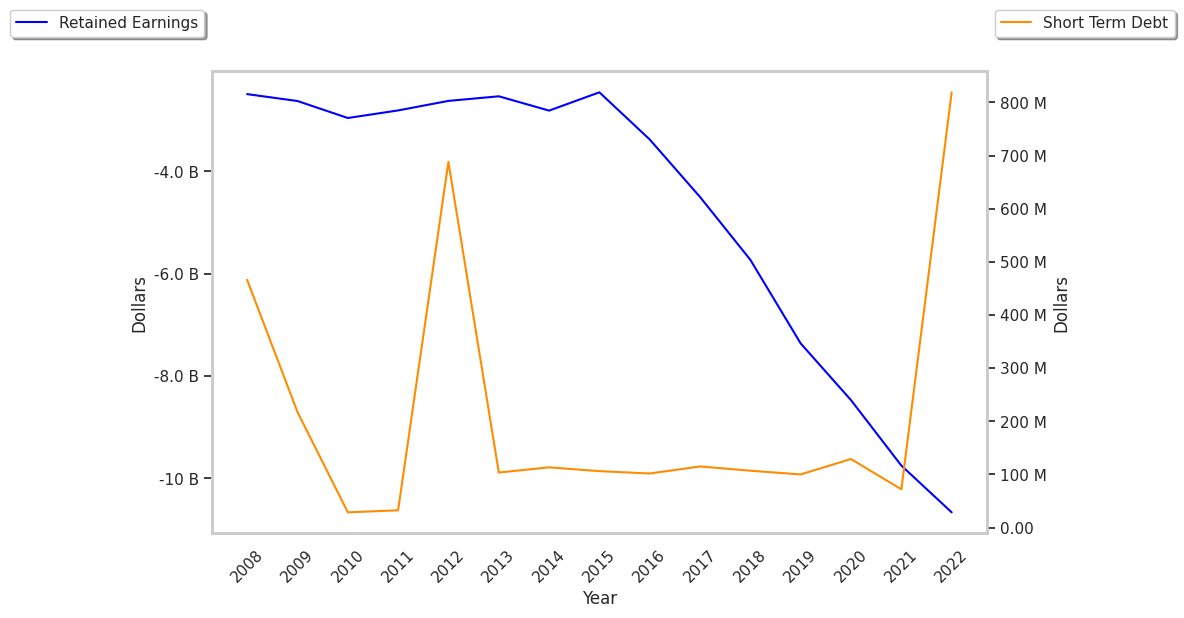
Crown Castle owns, operates and leases approximately 40,000 cell towers and approximately 90,000 route miles of fiber supporting small cells and fiber solutions across every major U.S. The company belongs to the Real Estate sector, which has an average price to earnings (P/E) ratio of 27.31. In contrast, Crown Castle has a trailing 12 month P/E ratio of -10.4 based on its earnings per share of $-9.0.
Crown Castle has moved -20.7% over the last year compared to 16.9% for the S&P 500 -- a difference of -37.6%. Crown Castle has a 52 week high of $120.92 and a 52 week low of $84.2.
The Company's Revenues Are Declining:
| 2019 | 2020 | 2021 | 2022 | 2023 | 2024 | |
|---|---|---|---|---|---|---|
| Revenue (M) | $5,763 | $5,840 | $6,340 | $6,986 | $6,981 | $6,568 |
| Operating Margins | 27% | 32% | 32% | 35% | 34% | -45% |
| Net Margins | 15% | 18% | 18% | 24% | 22% | -59% |
| Net Income (M) | $860 | $1,056 | $1,158 | $1,675 | $1,502 | -$3,903 |
| Net Interest Expense (M) | $21 | $31 | -$17 | -$699 | -$850 | -$932 |
| Depreciation & Amort. (M) | $1,572 | $1,608 | $1,644 | $1,707 | $1,754 | $1,300 |
| Diluted Shares (M) | 418 | 425 | 434 | 434 | 434 | 434 |
| Earnings Per Share | $1.79 | $2.35 | $2.53 | $3.86 | $3.46 | -$8.98 |
| EPS Growth | n/a | 31.28% | 7.66% | 52.57% | -10.36% | -359.54% |
| Avg. Price | $112.86 | $142.7 | $167.72 | $169.73 | $115.19 | $93.34 |
| P/E Ratio | 62.7 | 60.47 | 66.03 | 43.86 | 33.29 | -10.39 |
| Free Cash Flow (M) | $641 | $1,431 | $1,560 | $1,568 | $1,702 | $1,721 |
| CAPEX (M) | $2,057 | $1,624 | $1,229 | $1,310 | $1,424 | $1,222 |
| EV / EBITDA | 20.7 | 22.62 | 25.43 | 22.98 | 17.64 | -39.75 |
| Total Debt (M) | $18,121 | $19,280 | $20,629 | $21,729 | $22,921 | $24,684 |
| Net Debt / EBITDA | 5.73 | 5.49 | 5.58 | 5.22 | 5.53 | -15.01 |
| Current Ratio | 0.63 | 0.56 | 0.62 | 0.45 | 0.4 | 0.5 |
Crown Castle has slight revenue growth and decreasing reinvestment in the business, declining EPS growth, and not enough current assets to cover current liabilities because its current ratio is 0.5. On the other hand, the company has generally positive cash flows working in its favor.