Now trading at a price of $132.26, Paychex has moved -2.1% so far today.
Over the last year, Paychex logged a -0.1% change, with its stock price reaching a high of $161.24 and a low of $131.83. Over the same period, the stock underperformed the S&P 500 index by -16.9%. AThe company's 50-day average price was $140.59. Paychex, Inc., together with its subsidiaries, provides human capital management solutions (HCM) for payroll, employee benefits, human resources (HR), and insurance services for small to medium-sized businesses in the United States, Europe, and India. Based in Rochester, NY, the Large-Cap Industrials company has 19,000 full time employees. Paychex has offered a 3.0% dividend yield over the last 12 months.
Growing Revenues but an Average Current Ratio:
| 2019 | 2020 | 2021 | 2022 | 2023 | 2024 | |
|---|---|---|---|---|---|---|
| Revenue (M) | $4,040 | $4,057 | $4,612 | $5,007 | $5,278 | $5,572 |
| Operating Margins | 36% | 36% | 40% | 41% | 41% | 40% |
| Net Margins | 27% | 27% | 30% | 31% | 32% | 30% |
| Net Income (M) | $1,098 | $1,098 | $1,393 | $1,557 | $1,690 | $1,657 |
| Net Interest Expense (M) | -$23 | -$26 | -$15 | $15 | $44 | $38 |
| Depreciation & Amort. (M) | $128 | $123 | $192 | $177 | $176 | $119 |
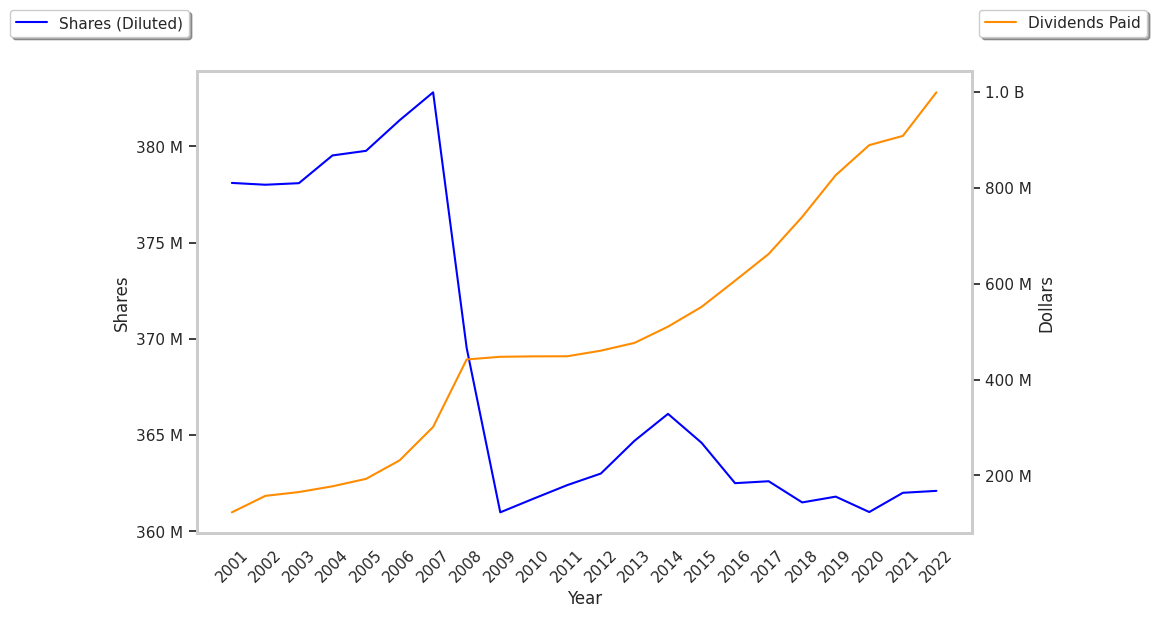
| Diluted Shares (M) | 362 | 363 | 362 | 362 | 362 | 362 |
| Earnings Per Share | $3.04 | $3.03 | $3.84 | $4.3 | $4.67 | $4.58 |
| EPS Growth | n/a | -0.33% | 26.73% | 11.98% | 8.6% | -1.93% |
| Avg. Price | $72.89 | $72.3 | $102.15 | $119.84 | $119.11 | $132.56 |
| P/E Ratio | 23.82 | 23.7 | 26.46 | 27.74 | 25.4 | 28.82 |
| Free Cash Flow (M) | $1,314 | $1,142 | $1,456 | $1,563 | $1,736 | $1,709 |
| CAPEX (M) | $127 | $118 | $134 | $143 | $161 | $192 |
| EV / EBITDA | 16.53 | 16.52 | 17.95 | 19.3 | 18.08 | 22.12 |
| Total Debt (M) | $797 | $797 | $798 | $798 | $799 | $5,348 |
| Net Debt / EBITDA | 0.07 | 0.1 | -0.15 | -0.26 | -0.17 | 1.6 |
| Current Ratio | 1.28 | 1.27 | 1.3 | 1.23 | 1.39 | 1.28 |
Paychex benefits from growing revenues and increasing reinvestment in the business, strong operating margins with a stable trend, and generally positive cash flows. The company's financial statements show positive EPS growth and healthy leverage levels. Furthermore, Paychex has just enough current assets to cover current liabilities, as shown by its current ratio of 1.28.
Paychex Has Elevated P/B and P/E Ratios:
Paychex has a trailing twelve month P/E ratio of 30.7, compared to an average of 24.03 for the Industrials sector. Based on its EPS guidance of $5.29, the company has a forward P/E ratio of 26.6. The 8.2% compound average growth rate of Paychex's historical and projected earnings per share yields a PEG ratio of 3.73. This suggests that these shares are overvalued. Furthermore, Paychex is likely overvalued compared to the book value of its equity, since its P/B ratio of 11.55 is higher than the sector average of 2.89. The company's shares are currently trading 285.8% below their Graham number. Overall, Paychex's lofty valuation in terms of earnings and assets is to some extent attenuated by its strong cash flow trend and reasonable levels of debt.
Paychex Has an Average Rating of Hold:
The 12 analysts following Paychex have set target prices ranging from $122.0 to $160.0 per share, for an average of $146.58 with a hold rating. The company is trading -9.8% away from its average target price, indicating that there is an analyst consensus of some upside potential.
Paychex has an average amount of shares sold short because 3.9% of the company's shares are sold short. Institutions own 81.5% of the company's shares, and the insider ownership rate stands at 10.62%, suggesting a large amount of insider shareholders. The largest shareholder is Vanguard Group Inc, whose 9% stake in the company is worth $4,260,882,295.