Baker Hughes logged a 2.0% change during today's afternoon session, and is now trading at a price of $47.2 per share.
Baker Hughes returned gains of 33.3% last year, with its stock price reaching a high of $49.4 and a low of $33.6. Over the same period, the stock outperformed the S&P 500 index by 15.9%. More recently, the company's 50-day average price was $43.42. Baker Hughes Company provides a portfolio of technologies and services to energy and industrial value chain worldwide. Based in Houston, TX, the Large-Cap Consumer Discretionary company has 57,000 full time employees. Baker Hughes has offered a 1.9% dividend yield over the last 12 months.
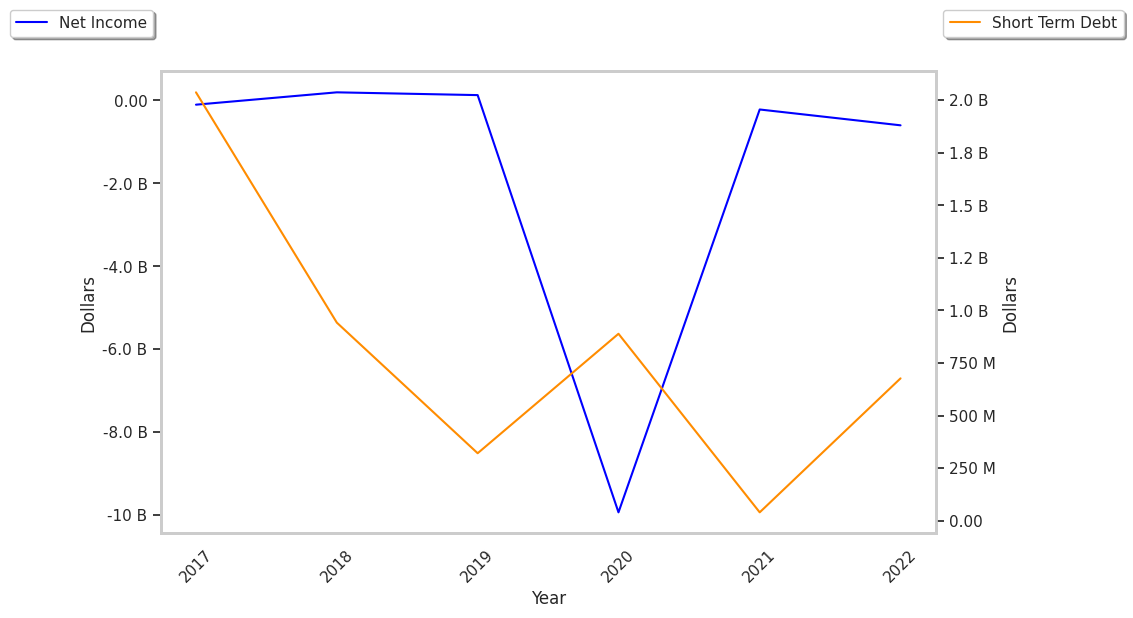
Generally Positive Cash Flows but an Average Current Ratio:
| 2019 | 2020 | 2021 | 2022 | 2023 | 2024 | |
|---|---|---|---|---|---|---|
| Revenue (M) | $23,838 | $20,705 | $20,502 | $21,156 | $25,506 | $27,829 |
| Operating Margins | 5% | -77% | 6% | 6% | 9% | 11% |
| Net Margins | 1% | -48% | -1% | -3% | 8% | 11% |
| Net Income (M) | $128 | -$9,940 | -$219 | -$601 | $1,943 | $2,979 |
| Net Interest Expense (M) | -$237 | -$264 | -$299 | -$252 | -$216 | -$198 |
| Depreciation & Amort. (M) | $1,418 | $1,317 | $1,105 | $1,061 | $1,087 | $870 |
| Diluted Shares (M) | 1,036 | 655 | 806 | 1,027 | 1,011 | 1,001 |
| Earnings Per Share | $0.23 | -$14.73 | -$0.27 | -$0.61 | $1.91 | $2.98 |
| EPS Growth | n/a | -6504.347826086956% | 98.16700610997964% | -125.92592592592591% | 413.11475409836066% | 56.020942408376975% |
| Avg. Price | $21.04 | $15.13 | $22.03 | $30.95 | $34.18 | $47.26 |
| P/E Ratio | 91.48 | -1.03 | -81.59 | -50.74 | 17.71 | 15.75 |
| Free Cash Flow (M) | $886 | $330 | $1,518 | $899 | $1,838 | $2,054 |
| CAPEX (M) | $1,240 | $974 | $856 | $989 | $1,224 | $1,278 |
| EV / EBITDA | 10.1 | -1.3 | 10.68 | 16.01 | 11.14 | 12.65 |
| Total Debt (M) | $6,622 | $7,633 | $6,727 | $6,657 | $6,020 | $6,023 |
| Net Debt / EBITDA | 1.35 | -0.24 | 1.19 | 1.86 | 0.99 | 0.67 |
| Current Ratio | 1.52 | 1.61 | 1.65 | 1.32 | 1.25 | 1.32 |
Baker Hughes has generally positive cash flows and growing revenues and a flat capital expenditure trend. Additionally, the company's financial statements display a strong EPS growth trend and healthy leverage levels. Furthermore, Baker Hughes has weak operating margins with a positive growth rate and just enough current assets to cover current liabilities, as shown by its current ratio of 1.32.
a Very Low P/E Ratio but Its Shares Are Expensive:
Baker Hughes has a trailing twelve month P/E ratio of 14.2, compared to an average of 20.93 for the Consumer Discretionary sector. Based on its EPS guidance of $2.57, the company has a forward P/E ratio of 16.9. According to the 41.2% compound average growth rate of Baker Hughes's historical and projected earnings per share, the company's PEG ratio is 0.34. Taking the weighted average of the company's EPS CAGR and the broader market's 5-year projected EPS growth rate, we obtain a normalized growth rate of 19.4%. On this basis, the company's PEG ratio is 0.73. This suggests that its shares are undervalued. Additionally, the market is possibly undervaluing Baker Hughes in terms of its equity because its P/B ratio is 2.63 whereas the sector average is 2.93. The company's shares are currently trading 40.3% below their Graham number.
There's an Analyst Consensus of Some Upside Potential for Baker Hughes:
The 21 analysts following Baker Hughes have set target prices ranging from $37.0 to $60.0 per share, for an average of $51.05 with a buy rating. The company is trading -7.5% away from its average target price, indicating that there is an analyst consensus of some upside potential.
Baker Hughes has an average amount of shares sold short because 3.3% of the company's shares are sold short. Institutions own 101.2% of the company's shares, and the insider ownership rate stands at 0.13%, suggesting a small amount of insider investors. The largest shareholder is Vanguard Group Inc, whose 15% stake in the company is worth $5,819,255,305.